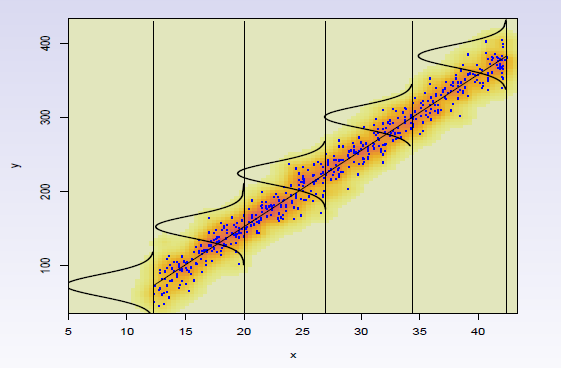
ggplot2: как изогнуть малые гауссовы плотности на линии регрессии?
1 ответов
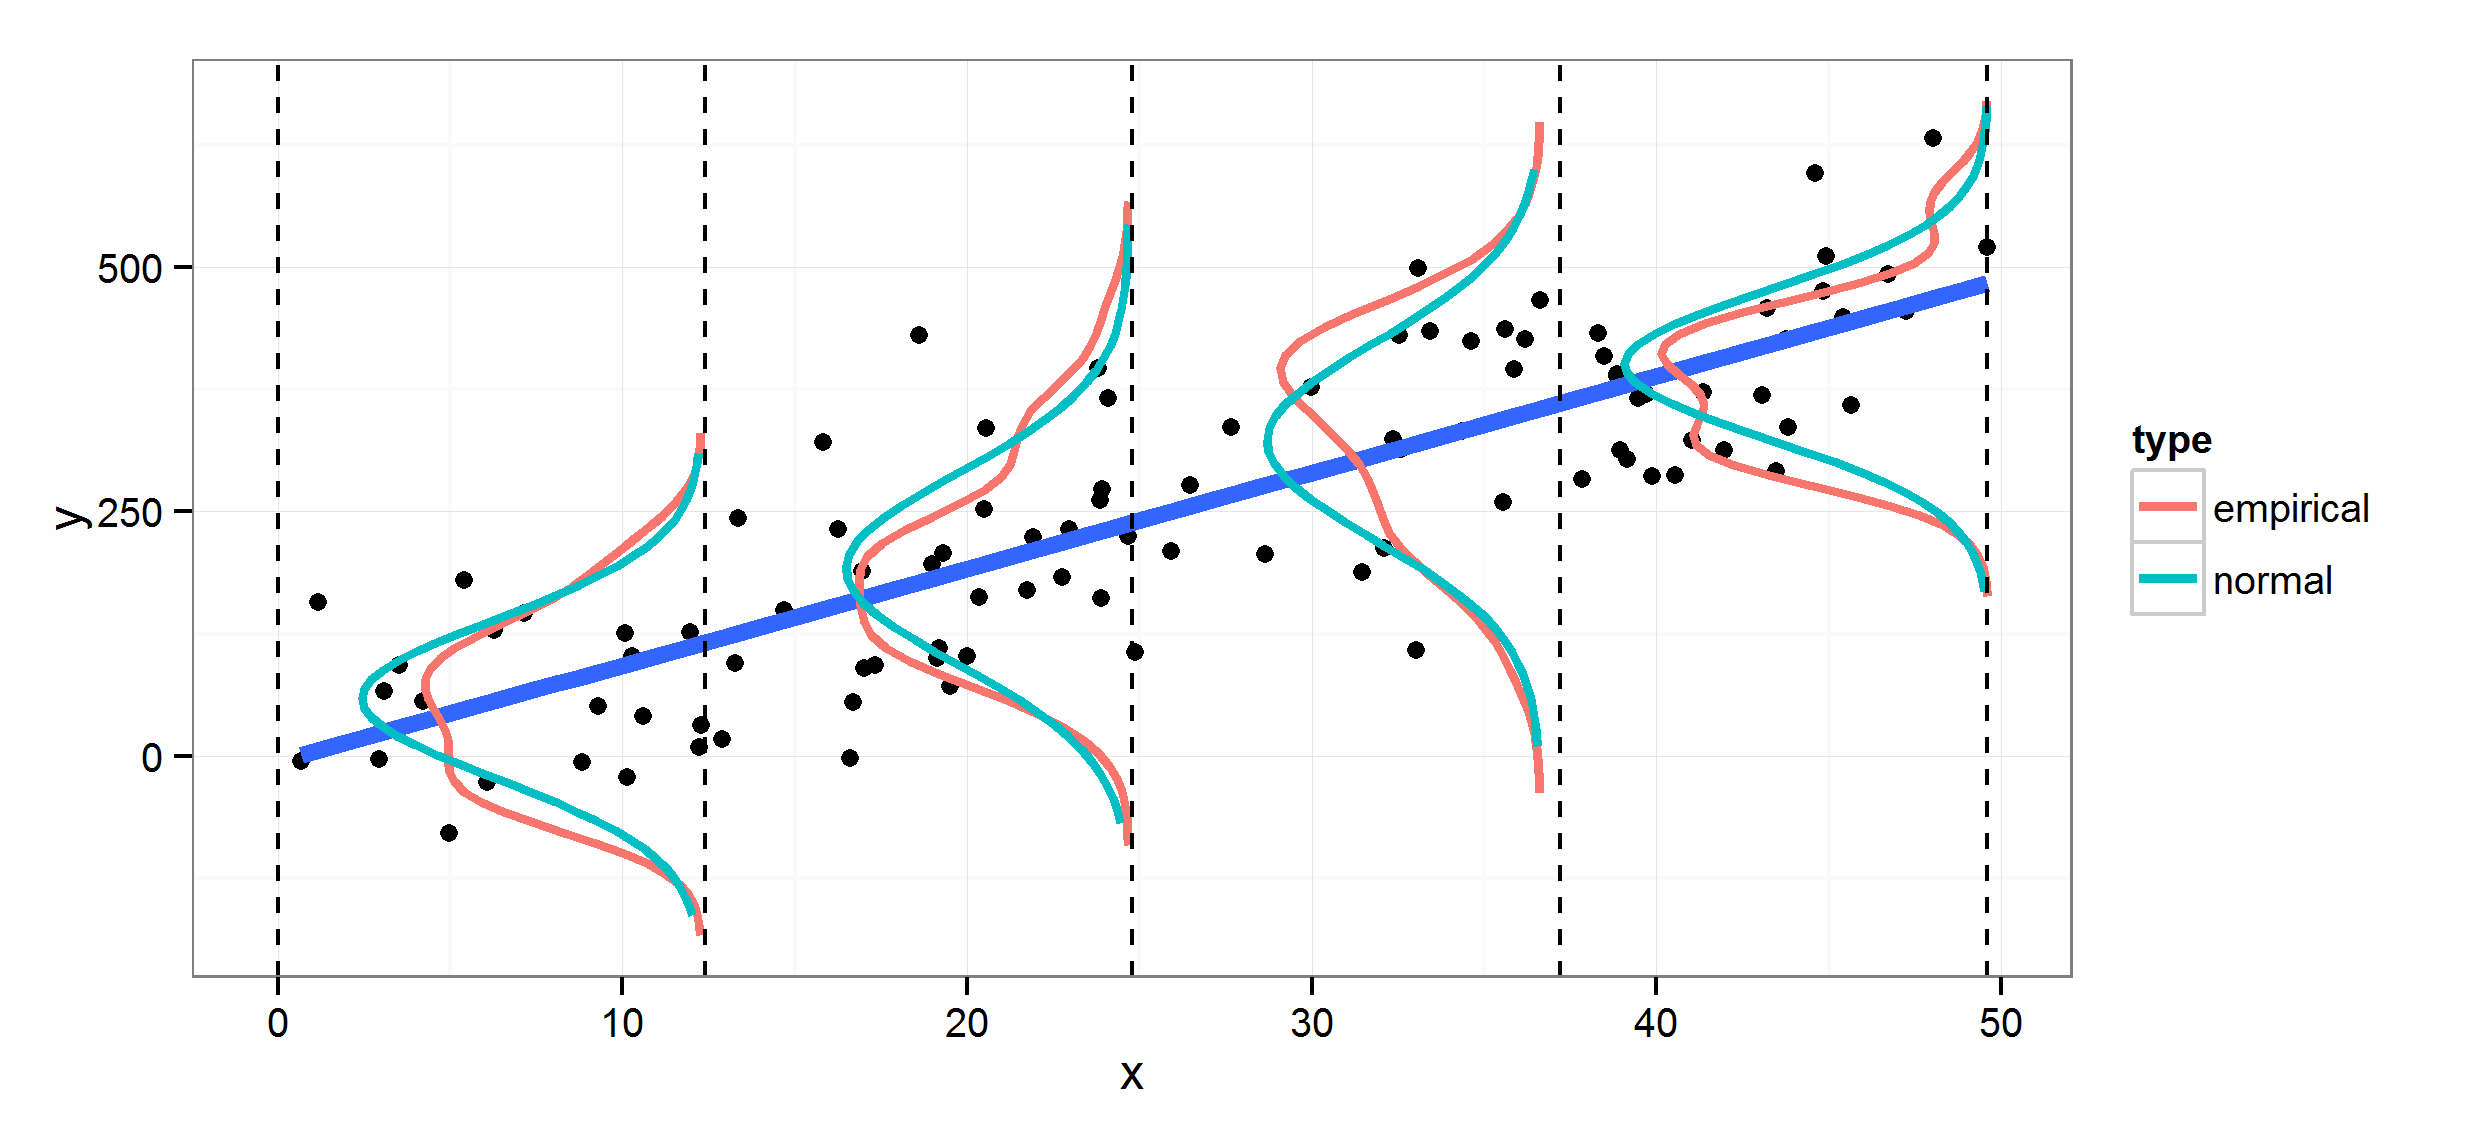
вы можете вычислить эмпирические плотности остатков для сечений вдоль установленной линии. Тогда это просто вопрос рисования линий на позициях по вашему выбору в каждом интервале, используя geom_path. Чтобы добавить теоретическое распределение, создайте некоторые плотности вдоль диапазона остатков для каждого раздела (здесь используется нормальная плотность). Для нормальных плотностей ниже стандартное отклонение для каждого из них определяется для каждого раздела из остатков, но вы можете просто выбрать стандартное отклонение для всех из них и использовать вместо этого.
## Sample data
set.seed(0)
dat <- data.frame(x=(x=runif(100, 0, 50)),
                  y=rnorm(100, 10*x, 100))

## breaks: where you want to compute densities
breaks <- seq(0, max(dat$x), len=5)
dat$section <- cut(dat$x, breaks)

## Get the residuals
dat$res <- residuals(lm(y ~ x, data=dat))

## Compute densities for each section, and flip the axes, and add means of sections
## Note: the densities need to be scaled in relation to the section size (2000 here)
dens <- do.call(rbind, lapply(split(dat, dat$section), function(x) {
    d <- density(x$res, n=50)
    res <- data.frame(x=max(x$x)- d$y*2000, y=d$x+mean(x$y))
    res <- res[order(res$y), ]
    ## Get some data for normal lines as well
    xs <- seq(min(x$res), max(x$res), len=50)
    res <- rbind(res, data.frame(y=xs + mean(x$y),
                                 x=max(x$x) - 2000*dnorm(xs, 0, sd(x$res))))
    res$type <- rep(c("empirical", "normal"), each=50)
    res
}))
dens$section <- rep(levels(dat$section), each=100)

## Plot both empirical and theoretical
ggplot(dat, aes(x, y)) +
  geom_point() +
  geom_smooth(method="lm", fill=NA, lwd=2) +
  geom_path(data=dens, aes(x, y, group=interaction(section,type), color=type), lwd=1.1) +
  theme_bw() +
  geom_vline(xintercept=breaks, lty=2)
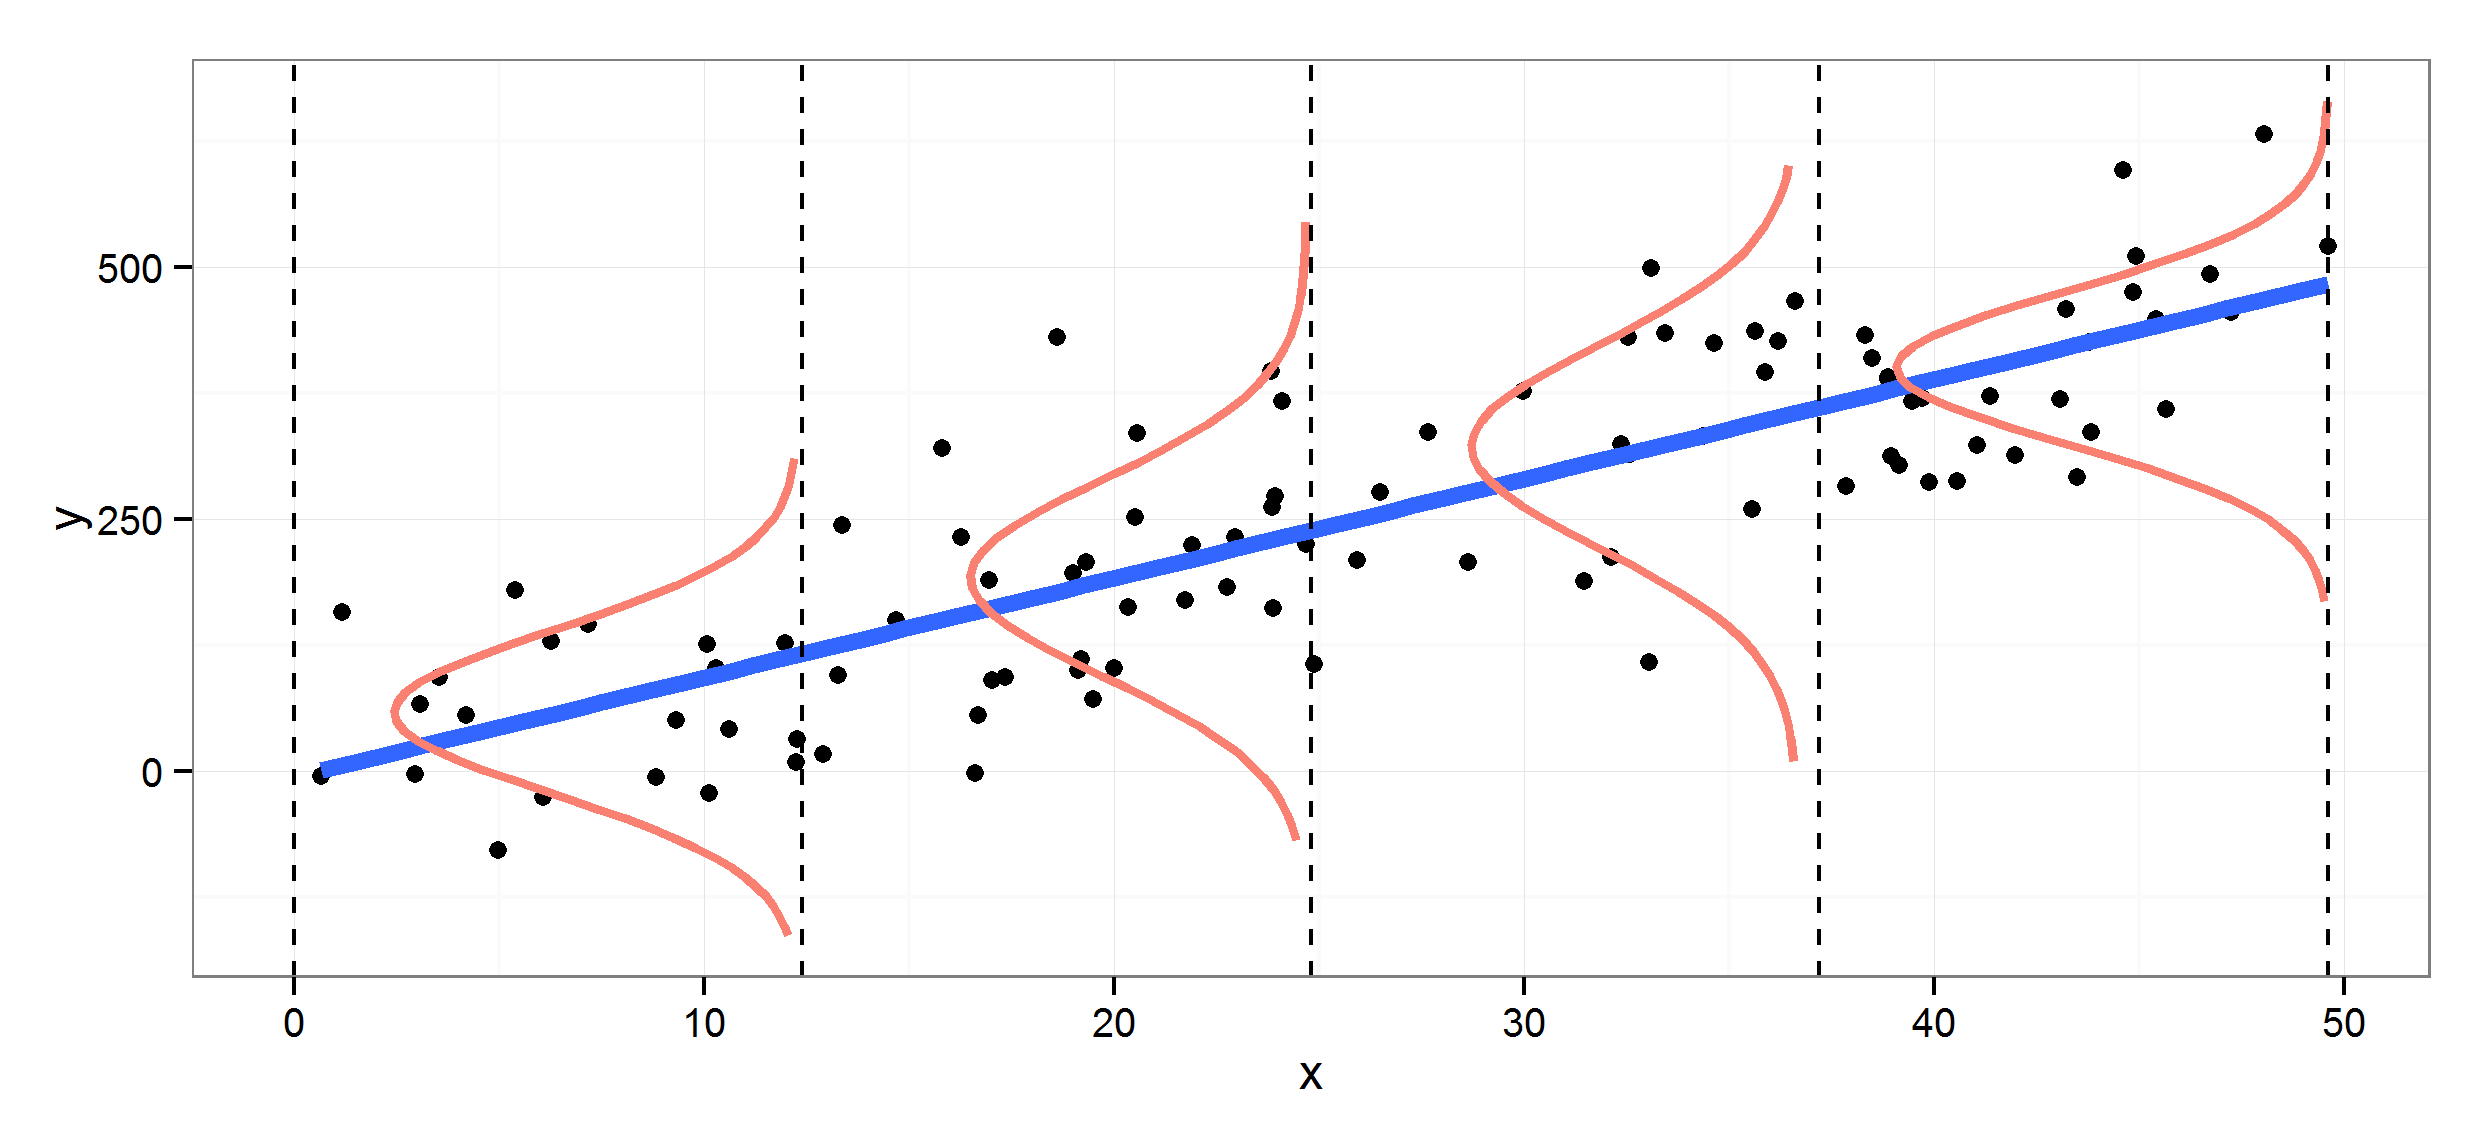
или, просто гауссовы кривые
## Just normal
ggplot(dat, aes(x, y)) +
  geom_point() +
  geom_smooth(method="lm", fill=NA, lwd=2) +
  geom_path(data=dens[dens$type=="normal",], aes(x, y, group=section), color="salmon", lwd=1.1) +
  theme_bw() +
  geom_vline(xintercept=breaks, lty=2)


