Как добавить две легенды в один сюжет в MATLAB?
Я хотел бы добавить две легенды к сюжету в MATLAB. Как я могу это сделать?
4 ответов
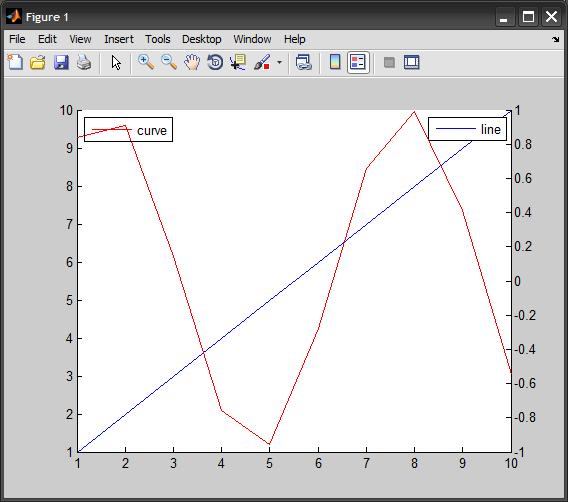
вы можете создать вторую наложенную ось с собственной легендой (в другом месте, конечно).
EDIT:
вот пример:
%# create some plot with a legend
hAx(1) = axes();
hLine(1) = plot(1:10, 'Parent',hAx(1));
set(hAx(1), 'Box','off')
legend(hLine(1), 'line')

%# copy the axis
hAx(2) = copyobj(hAx(1),gcf);
delete( get(hAx(2),'Children') )            %# delete its children
hLine(2) = plot(sin(1:10), 'Color','r', 'Parent',hAx(2));
set(hAx(2), 'Color','none', 'XTick',[], ...
    'YAxisLocation','right', 'Box','off')   %# make it transparent
legend(hLine(2), {'curve'}, 'Location','NorthWest', 'Color','w')

чтобы создать липкую легенду, вы можете позвонить copyobj
handle_legend = legend(handle_plot, 'string1');
copyobj(handle_legend, handle_figure);
на copyobj функция просто сохраняет свою связанную легенду внутри рисунка.
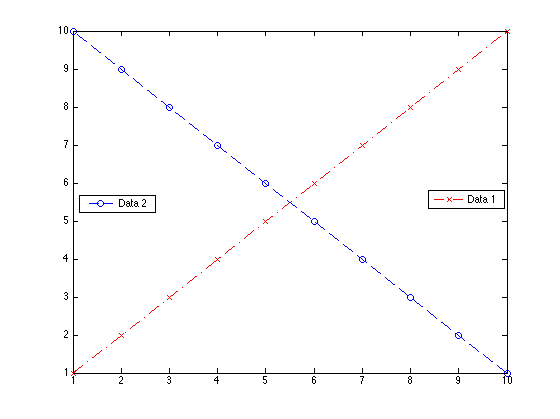
это работает в пределах одной оси (нет необходимости создавать вторые наложенные оси), и несколько легенд могут быть добавлены таким образом.
пример:
%declare figure
hfigure = figure('Color', 'w');

%plot 2 lines (red and blue)
hplot1 = plot(1:10,'r-.x');
hold on;
hplot2 = plot(10:-1:1,'b--o');

%plot legends
hlegend1 = legend(hplot1, 'Data 1', 'Location','East'); %display legend 1
new_handle = copyobj(hlegend1,hfigure);                 %copy legend 1 --> retain
legend(hplot2, 'Data 2', 'Location','West');            %display legend 2

пример для нескольких участков :
hAx(1) = axes();
hold on
hLine(1) = plot(1:10, 'Parent',hAx(1),'color','b');
hLine(2) = plot(3:15, 'Parent',hAx(1),'color','b', 'linestyle','--');
set(hAx(1), 'Box','off')
legend([hLine(1), hLine(2)],{ 'line' 'line2'})

%# copy the axis
hAx(2) = copyobj(hAx(1),gcf);
delete( get(hAx(2),'Children') )            %# delete its children
hold on
hLine(3) = plot(sin(1:10), 'Color','r','Parent',hAx(2));
hLine(4) = plot(cos(1:10), 'Color','r','linestyle','--','Parent',hAx(2));
hold off
set(hAx(2), 'Color','none', 'XTick',[], ...
'YAxisLocation','right', 'Box','off')   %# make it transparent
legend([hLine(3),hLine(4)], {'sin' , 'cos'}, 'Location','NorthWest', 'Color','w')
%legend(hLine(3), {'sin'}, 'Location','NorthWest', 'Color','w')
после того, как вы сделали первую легенду, сделайте новую, невидимую ручку оси:
ax=axes('Position',get(gca,'Position'),'Visible','Off');
теперь сделайте вторую легенду в новой оси:
legend(ax,...);
это в основном то же самое, что и ответ @Amro, но проще и короче.
