Как соответствовать результату matplotlib.pyplot.contourf в круг?
вот мой код для построения некоторых данных:
from scipy.interpolate import griddata
from numpy import linspace
import matplotlib.pyplot as plt
meanR = [9.95184937,   9.87947708,   9.87628496,   9.78414422,
         9.79365258,   9.96168969,   9.87537519,   9.74536093,
        10.16686878,  10.04425475,  10.10444126,  10.2917172 ,
        10.16745917,  10.0235203 ,   9.89914   ,  10.11263505,
         9.99756449,  10.17861254,  10.04704248]
koord = [[1,4],[3,4],[1,3],[3,3],[2,3],[1,2],[3,2],[2,2],[1,1],[3,1],[2,1],[1,0],[3,0],[0,3],[4,3],[0,2],[4,2],[0,1],[4,1]]
x,y=[],[]
for i in koord:
    x.append(i[0])
    y.append(i[1])
z = meanR
xi = linspace(-2,6,300);
yi = linspace(-2,6,300);
zi = griddata((x, y), z, (xi[None,:], yi[:,None]), method='cubic')
CS = plt.contourf(xi,yi,zi,15,cmap=plt.cm.jet)
plt.scatter(x,y,marker='o',c='b',s=15)
plt.xlim(min(x),max(x))
plt.ylim(min(y),max(y))
plt.show()
в результате имеем:
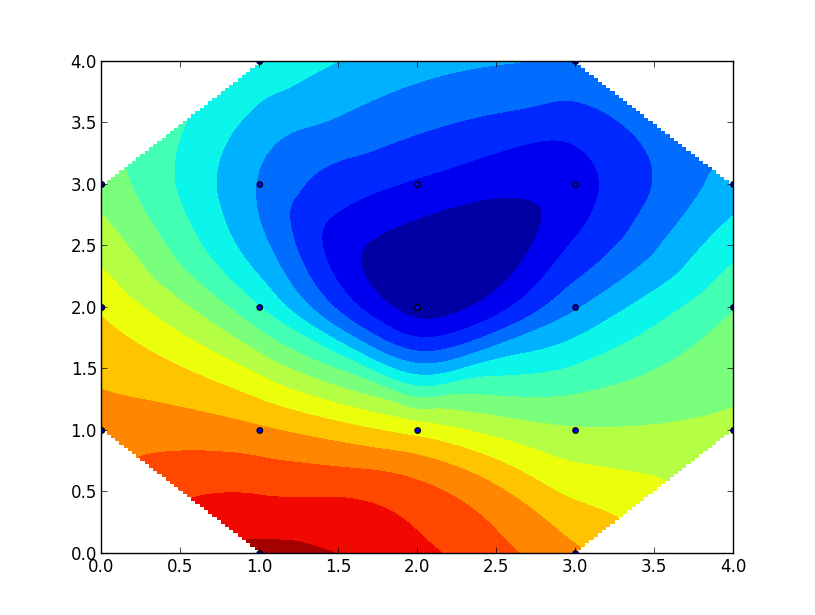
Как я могу вписать его в круг? что-то вроде этого!--9-->
2 ответов
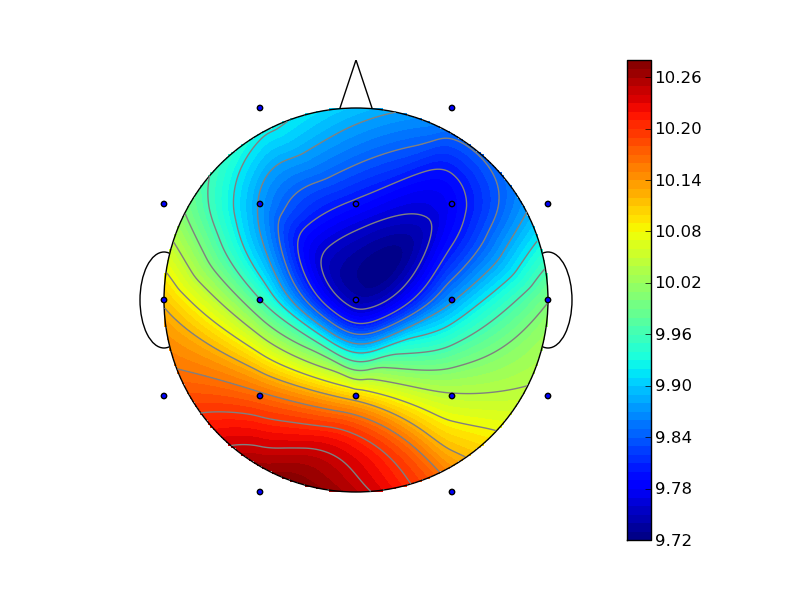
поскольку вам, похоже, не нужны оси, вы также можете использовать нормальную проекцию, удалить оси и нарисовать круг. Я немного повеселился и добавил бонусные уши, нос и цветную полосу. Я аннотировал код, надеюсь, он понятен.
from __future__ import print_function
from __future__ import division
from __future__ import absolute_import

import scipy.interpolate
import numpy
import matplotlib
import matplotlib.pyplot as plt

# close old plots
plt.close("all")

# some parameters
N = 300             # number of points for interpolation
xy_center = [2,2]   # center of the plot
radius = 2          # radius

# mostly original code
meanR = [9.95184937,   9.87947708,   9.87628496,   9.78414422,
         9.79365258,   9.96168969,   9.87537519,   9.74536093,
        10.16686878,  10.04425475,  10.10444126,  10.2917172 ,
        10.16745917,  10.0235203 ,   9.89914   ,  10.11263505,
         9.99756449,  10.17861254,  10.04704248]

koord = [[1,4],[3,4],[1,3],[3,3],[2,3],[1,2],[3,2],[2,2],[1,1],[3,1],[2,1],[1,0],[3,0],[0,3],[4,3],[0,2],[4,2],[0,1],[4,1]]

x,y = [],[]
for i in koord:
    x.append(i[0])
    y.append(i[1])

z = meanR

xi = numpy.linspace(-2, 6, N)
yi = numpy.linspace(-2, 6, N)
zi = scipy.interpolate.griddata((x, y), z, (xi[None,:], yi[:,None]), method='cubic')

# set points > radius to not-a-number. They will not be plotted.
# the dr/2 makes the edges a bit smoother
dr = xi[1] - xi[0]
for i in range(N):
    for j in range(N):
        r = numpy.sqrt((xi[i] - xy_center[0])**2 + (yi[j] - xy_center[1])**2)
        if (r - dr/2) > radius:
            zi[j,i] = "nan"

# make figure
fig = plt.figure()

# set aspect = 1 to make it a circle
ax = fig.add_subplot(111, aspect = 1)

# use different number of levels for the fill and the lines
CS = ax.contourf(xi, yi, zi, 60, cmap = plt.cm.jet, zorder = 1)
ax.contour(xi, yi, zi, 15, colors = "grey", zorder = 2)

# make a color bar
cbar = fig.colorbar(CS, ax=ax)

# add the data points
# I guess there are no data points outside the head...
ax.scatter(x, y, marker = 'o', c = 'b', s = 15, zorder = 3)

# draw a circle
# change the linewidth to hide the
circle = matplotlib.patches.Circle(xy = xy_center, radius = radius, edgecolor = "k", facecolor = "none")
ax.add_patch(circle)

# make the axis invisible
for loc, spine in ax.spines.iteritems():
    # use ax.spines.items() in Python 3
    spine.set_linewidth(0)

# remove the ticks
ax.set_xticks([])
ax.set_yticks([])

# Add some body parts. Hide unwanted parts by setting the zorder low
# add two ears
circle = matplotlib.patches.Ellipse(xy = [0,2], width = 0.5, height = 1.0, angle = 0, edgecolor = "k", facecolor = "w", zorder = 0)
ax.add_patch(circle)
circle = matplotlib.patches.Ellipse(xy = [4,2], width = 0.5, height = 1.0, angle = 0, edgecolor = "k", facecolor = "w", zorder = 0)
ax.add_patch(circle)
# add a nose
xy = [[1.5,3], [2,4.5],[2.5,3]]
polygon = matplotlib.patches.Polygon(xy = xy, facecolor = "w", zorder = 0)
ax.add_patch(polygon)

# set axes limits
ax.set_xlim(-0.5, 4.5)
ax.set_ylim(-0.5, 4.5)

plt.show()
если вы замените часть, где вы делаете заговор с:
fig = plt.figure()
ax = fig.add_subplot(111, polar=True)
CS = ax.contourf(xi,yi,zi,15,cmap=plt.cm.jet)
ax.scatter(x,y,marker='o',c='b',s=15)
ax.set_xlim(min(x),max(x))
ax.set_ylim(min(y),max(y))
вы получили это 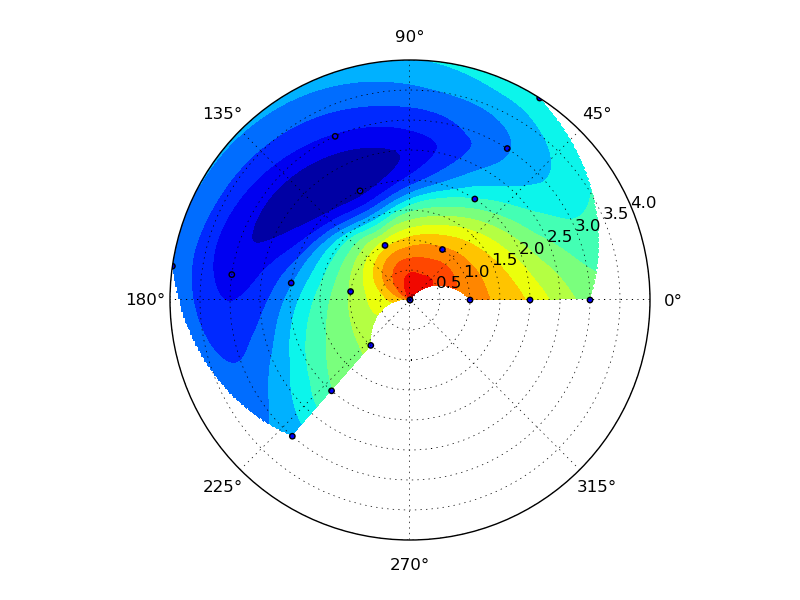
чтобы получить то, что вы хотите, вы должны изменить x, y, xi, yi такое, что изображение центрируется в нуль. Возможно, Вам также потребуется преобразовать в полярные координаты. Сейчас у меня нет времени, чтобы предоставить больше информации, но я надеюсь, что это поможет вам в начало