Как я могу показать точки в Oxyplot на графике?
вот код xaml для моего графика:
<oxy:Plot HorizontalAlignment="Left"
              Height="222"
              Margin="0,49,0,0"
              VerticalAlignment="Top"
              Width="870"
              Background="Transparent"
              PlotAreaBorderColor="White"
              LegendBorder="Transparent"
              Name="viewCountPlot"
              Title="Videos Watched"
              TextColor="White" IsLegendVisible="False" IsManipulationEnabled="False" IsMouseWheelEnabled="False">
        <oxy:Plot.Axes>
            <oxy:DateTimeAxis Name="datetimeAxis" Position="Bottom" MajorGridlineColor="#40FFFFFF" TicklineColor="White" StringFormat="M/d/yy" IntervalType="Days" ShowMinorTicks="False"/>
        </oxy:Plot.Axes>
        <oxy:Plot.Series>
            <oxy:LineSeries
                Name="viewCountSeries"
                Title="Videos Viewed"
                DataFieldX="Date"
                DataFieldY="Value"
                Color="#CCFA6800"
                StrokeThickness="2"
                TrackerFormatString="Date: {2:M/d/yy}
Value: {4}"
                ItemsSource="{Binding PlotItems}" MarkerStroke="#FFFDFDFD" />
        </oxy:Plot.Series>
        <oxy:Plot.DefaultTrackerTemplate>
            <ControlTemplate>
                <Canvas>
                    <Grid Canvas.Left="{Binding Position.X}" Canvas.Top="{Binding Position.Y}">
                        <Ellipse Fill="White" Width="12" Height="12" HorizontalAlignment="Left" VerticalAlignment="Top">
                            <Ellipse.RenderTransform>
                                <TranslateTransform X="-6" Y="-6" />
                            </Ellipse.RenderTransform>
                        </Ellipse>
                        <TextBlock Foreground="{DynamicResource OrangeTextColor}" Text="{Binding}" Margin="-60 -40 0 0" />
                    </Grid>
                </Canvas>
            </ControlTemplate>
        </oxy:Plot.DefaultTrackerTemplate>
    </oxy:Plot>
в серии сюжетов есть ли способ показать точки сюжета как круги или что-то в этом роде?
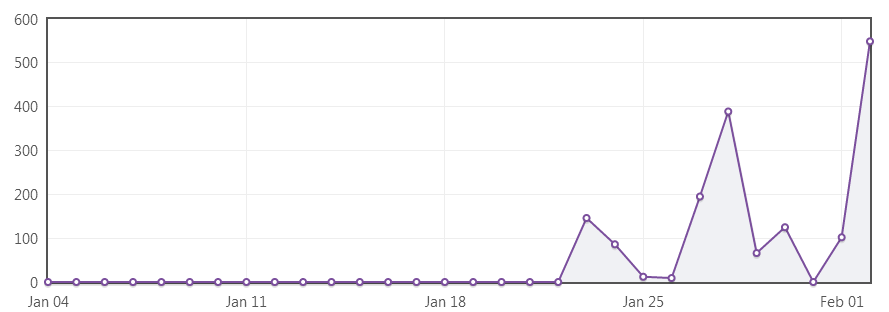
вот пример изображения того, что я имею в виду, каждая точка графика имеет небольшой круг, связанный с ней:
2 ответов
из связанного обсуждения:
это должно быть покрыто
Marker*свойстваLineSeriesСм. примеры в браузере примеров.
похоже, вам нужно установить MarkerFill и MarkerType. Чтобы показать только маркеры (и без линии), установите Color to Transparent.
<oxy:LineSeries ItemsSource="{Binding MyDataPoints}"
                Color="Transparent"
                MarkerFill="SteelBlue"
                MarkerType="Circle" />