Пользовательский динамический график в Android
[обновление]
Чтобы завершить этот вопрос, я реализовал свой график, используя следующие два метода (см. ниже). drawCurve() получает Canvas и массив float. Массив правильно заполнен (временные метки принимаются индексом значения в массиве) и варьируется от 0.0 до 1.0. Массив отправляется в prepareWindowArray() это занимает кусок массива из позиции windowStart на windowSize-значения, по кругу.
массив, используемый GraphView и поставщик данных (устройство Bluetooth) является тем же. Класс в середине гарантирует, что GraphView не читает данные, записываемые устройством Bluetooth. Поскольку GraphView всегда проходит через массив и перерисовывает его на каждой итерации, он будет обновляться в соответствии с данными, записанными устройством Bluetooth, и, заставляя частоту записи устройства Bluetooth к частоте обновления графика, я получаю плавную анимацию моего сигнала.
на GraphView ' s invalidate() метод вызывается методом Activity, которые работают в Timer чтобы обновить график на каждом x миллисекундах. Частота, на которой обновляется график, динамически устанавливается, чтобы он адаптировался к потоку данных с устройства Bluetooth (которые задают частоту его сигнала в заголовке его пакета).
найти полный код моего GraphView в ответе я написал ниже (в разделе ответов). Если вы нашли ошибки или способ оптимизировать его, пожалуйста, дайте мне знать; это был бы очень признателен!
/**
 * Read a buffer array of size greater than "windowSize" and create a window array out of it.
 * A curve is then drawn from this array using "windowSize" points, from left
 * to right.
 * @param canvas is a Canvas object on which the curve will be drawn.  Ensure the canvas is the
 * later drawn object at its position or you will not see your curve.
 * @param data is a float array of length > windowSize.  The floats must range between 0.0 and 1.0.
 * A value of 0.0 will be drawn at the bottom of the graph, while a value of 1.0 will be drawn at
 * the top of the graph.  The range is not tested, so you must ensure to pass proper values, or your
 * graph will look terrible.
 *      0.0  : draw at the bottom of the graph
 *      0.5  : draw in the middle of the graph
 *      1.0  : draw at the top of the graph
 */
private void drawCurve(Canvas canvas, float[] data){

    // Create a reference value to determine the stepping between each points to be drawn
    float incrementX = (mRightSide-mLeftSide)/(float) windowSize;

    float incrementY = (mBottomSide - mTopSide);

    // Prepare the array for the graph
    float[] source = prepareWindowArray(data);

    // Prepare the curve Path
    curve = new Path();
    // Move at the first point.
    curve.moveTo(mLeftSide, source[0]*incrementY);
    // Draw the remaining points of the curve
    for(int i = 1; i < windowSize; i++){
        curve.lineTo(mLeftSide + (i*incrementX), source[i] * incrementY);
    }

    canvas.drawPath(curve, curvePaint);

}
на prepareWindowArray() метод, реализующий круговое поведение массива:
/**
 * Extract a window array from the data array, and reposition the windowStart
 * index for next iteration
 * @param data the array of data from which we get the window
 * @return an array of float that represent the window
 */
private float[] prepareWindowArray(float[] data){
    // Prepare the source array for the graph.
    float[] source = new float[windowSize];

    // Copy the window from the data array into the source array
    for(int i = 0; i < windowSize; i++){
        if(windowStart+i < data.length)                         // If the windows holds within the data array
            source[i] = data[windowStart + i];                  // Simply copy the value in the source array
        else{                                                   // If the window goes beyond the data array
            source[i] = data[(windowStart + 1)%data.length];    // Loop at the beginning of the data array and copy from there
        }
    }
    // Reposition the buffer index
    windowStart = windowStart + windowSize;
    // If the index is beyond the end of the array
    if(windowStart >= data.length){
        windowStart = windowStart % data.length;
    }

    return source;
}
[/UPDATE]
я делаю приложение, которое считывает данные с устройства Bluetooth с фиксированной скоростью. Каждый раз, когда у меня появляются новые данные, я хочу, чтобы они были нанесены на график справа, а оставшуюся часть графика перевести налево в реальном времени. В принципе, как осциллограф делать.
поэтому я сделал пользовательский вид с осью xy, заголовком и единицами. Чтобы сделать это, я просто рисую эти вещи на холсте просмотра. Теперь я хочу нарисовать кривую. Мне удается нарисовать статическую кривую из уже заполненного массива, используя этот метод:
public void drawCurve(Canvas canvas){

    int left = getPaddingLeft();
    int bottom = getHeight()-getPaddingTop();
    int middle = (bottom-10)/2 - 10;

    curvePaint = new Paint();
    curvePaint.setColor(Color.GREEN);
    curvePaint.setStrokeWidth(1f);
    curvePaint.setDither(true);
    curvePaint.setStyle(Paint.Style.STROKE);
    curvePaint.setStrokeJoin(Paint.Join.ROUND);
    curvePaint.setStrokeCap(Paint.Cap.ROUND);
    curvePaint.setPathEffect(new CornerPathEffect(10) );
    curvePaint.setAntiAlias(true);

    mCurve = new Path();
    mCurve.moveTo(left, middle);
    for(int i = 0; i < mData[0].length; i++)
        mCurve.lineTo(left + ((float)mData[0][i] * 5), middle-((float)mData[1][i] * 20));


    canvas.drawPath(mCurve, curvePaint);
}
это дает мне что-то вроде этого.
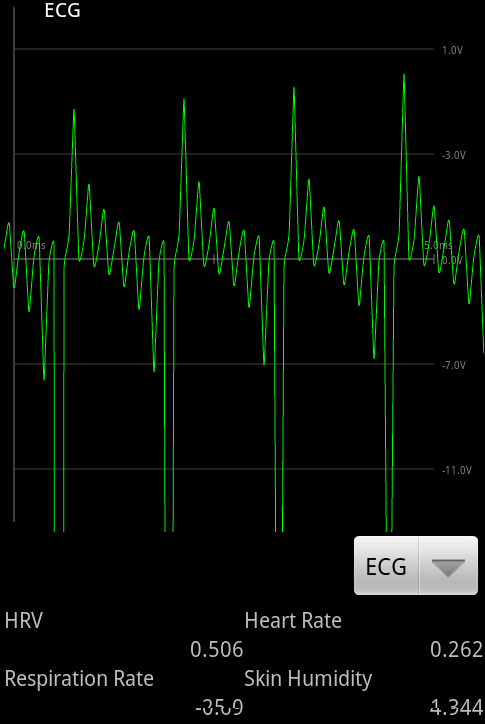
есть еще вещи, которые нужно исправить на моем графике (подоси не правильно масштабируются), но это детали, которые я могу исправить позже.
теперь я хочу изменить этот статический график (который получает нединамическую матрицу значений) с чем-то динамическим, что будет перерисовывать кривую каждые 40 мс, подталкивая старые данные влево и рисуя новые данные вправо, чтобы я мог визуализировать в режиме реального времени информацию, предоставляемую устройством Bluetooth.
я знаю, что есть какой-то графический пакет, который уже существует, но я вроде как noob с этими вещами, и я хотел бы pratice, реализуя это график себя. Кроме того, большая часть моего класса GraphView выполнена, за исключением части кривой.
второй вопрос, мне интересно, как я должен отправить новые значения на график. Должен ли я использовать что-то вроде стека FIFO, или я могу достичь того, что хочу, с простым матрицей двойников?
на боковой ноте 4 поля внизу уже динамически обновляются. Ну, они вроде как притворяются "динамичными", они петляют через одну и ту же двойную матрицу снова и снова, они не на самом деле возьмите свежие ценности.
Спасибо за ваше время! Если что-то неясно о моем вопросе, дайте мне знать, и я обновлю его с более подробной информацией.
2 ответов
Как упоминалось в моем вопросе, вот класс, который я разработал для решения своих проблем.
/**
 * A View implementation that displays a scatter graph with
 * automatic unit scaling.
 *
 * Call the <i>setupGraph()</i> method to modify the graph's
 * properties.
 * @author Antoine Grondin
 *
 */

public class GraphView extends View {

    //////////////////////////////////////////////////////////////////
    // Configuration
    //////////////////////////////////////////////////////////////////

    // Set to true to impose the graph properties
    private static final boolean TEST = false;

    // Scale configuration
    private float minX = 0;         // When TEST is true, these values are used to
    private float maxX = 50;        // Draw the graph
    private float minY = 0;
    private float maxY = 100;

    private String titleText = "A Graph...";
    private String xUnitText = "s";
    private String yUnitText = "Volts";

    // Debugging variables
    private boolean D = true;
    private String TAG = "GraphView";

    //////////////////////////////////////////////////////////////////
    // Member fields
    //////////////////////////////////////////////////////////////////

    // Represent the borders of the View
    private int mTopSide = 0;
    private int mLeftSide = 0;
    private int mRightSide = 0;
    private int mBottomSide = 0;
    private int mMiddleX = 0;
    // Size of a DensityIndependentPixel
    private float mDips = 0;

    // Hold the position of the axis in regard to the range of values
    private int positionOfX = 0;
    private int positionOfY = 0;

    // Index for the graph array window, and size of the window
    private int windowStart = 0;
    private int windowSize = 128;
    private float[] dataSource;

    // Painting tools
    private Paint xAxisPaint;
    private Paint yAxisPaint;
    private Paint tickPaint;
    private Paint curvePaint;
    private Paint backgroundPaint;

    private TextPaint unitTextPaint;
    private TextPaint titleTextPaint;

    // Object to be drawn

    private Path curve;
    private Bitmap background;

    ///////////////////////////////////////////////////////////////////////////////
    // Constructors
    ///////////////////////////////////////////////////////////////////////////////

    public GraphView(Context context) {
        super(context);
        init();
    }

    public GraphView(Context context, AttributeSet attrs){
        super(context, attrs);
        init();
    }

    public GraphView(Context context, AttributeSet attrs, int defStyle){
        super(context, attrs, defStyle);
        init();
    }

    ///////////////////////////////////////////////////////////////////////////////
    // Configuration methods
    ///////////////////////////////////////////////////////////////////////////////

    public void setupGraph(String title, String nameOfX, float min_X, float max_X, String nameOfY, float min_Y, float max_Y){
        if(!TEST){
            titleText = title;
            xUnitText = nameOfX;
            yUnitText = nameOfY;
            minX = min_X;
            maxX = max_X;
            minY = min_Y;
            maxY = max_Y;
        }
    }

    /**
     * Set the array this GraphView is to work with.
     * @param data is a float array of length > windowSize.  The floats must range between 0.0 and 1.0.
     * A value of 0.0 will be drawn at the bottom of the graph, while a value of 1.0 will be drawn at
     * the top of the graph.  The range is not tested, so you must ensure to pass proper values, or your
     * graph will look terrible.
     *      0.0  : draw at the bottom of the graph
     *      0.5  : draw in the middle of the graph
     *      1.0  : draw at the top of the graph
     */
    public void setDataSource(float[] data){
        this.dataSource = data;
    }

    ///////////////////////////////////////////////////////////////////////////////
    // Initialization methods
    ///////////////////////////////////////////////////////////////////////////////

    private void init(){
        initDrawingTools();
    }

    private void initConstants(){
        mDips = getResources().getDisplayMetrics().density;
        mTopSide = (int) (getTop() + 10*mDips);
        mLeftSide = (int) (getLeft() + 10*mDips);
        mRightSide = (int) (getMeasuredWidth() - 10*mDips);
        mBottomSide = (int) (getMeasuredHeight() - 10*mDips);
        mMiddleX = (mRightSide - mLeftSide)/2 + mLeftSide;
    }

    private void initWindowSetting() throws IllegalArgumentException {

        // Don't do anything if the given values make no sense
        if(maxX < minX || maxY < minY ||
                maxX == minX || maxY == minY){
            throw new IllegalArgumentException("Max and min values make no sense");
        }
        // Transform the values in scanable items
        float[][] maxAndMin = new float[][]{
                {minX, maxX},
                {minY, maxY}};
        int[] positions = new int[]{positionOfY, positionOfX};

        // Place the X and Y axis in regard to the given max and min
        for(int i = 0; i<2; i++){
            if(maxAndMin[i][0] < 0f){
                if(maxAndMin[i][1] < 0f){
                    positions[i] = (int) maxAndMin[i][0];
                } else{
                    positions[i] = 0;
                }
            } else if (maxAndMin[i][0] > 0f){
                positions[i] = (int) maxAndMin[i][0];
            } else {
                positions[i] = 0;
            }
        }

        // Put the values back in their right place
        minX = maxAndMin[0][0];
        maxX = maxAndMin[0][1];
        minY = maxAndMin[1][0];
        maxY = maxAndMin[1][1];

        positionOfY = mLeftSide +  (int) (((positions[0] - minX)/(maxX-minX))*(mRightSide - mLeftSide));
        positionOfX = mBottomSide - (int) (((positions[1] - minY)/(maxY-minY))*(mBottomSide - mTopSide));
    }

    private void initDrawingTools(){

        xAxisPaint = new Paint();
        xAxisPaint.setColor(0xff888888);
        xAxisPaint.setStrokeWidth(1f*mDips);
        xAxisPaint.setAlpha(0xff);
        xAxisPaint.setAntiAlias(true);

        yAxisPaint = xAxisPaint;

        tickPaint = xAxisPaint;
        tickPaint.setColor(0xffaaaaaa);

        curvePaint = new Paint();
        curvePaint.setColor(0xff00ff00);
        curvePaint.setStrokeWidth(1f*mDips);
        curvePaint.setDither(true);
        curvePaint.setStyle(Paint.Style.STROKE);
        curvePaint.setStrokeJoin(Paint.Join.ROUND);
        curvePaint.setStrokeCap(Paint.Cap.ROUND);
        curvePaint.setPathEffect(new CornerPathEffect(10));
        curvePaint.setAntiAlias(true);

        backgroundPaint = new Paint();
        backgroundPaint.setFilterBitmap(true);

        titleTextPaint = new TextPaint();
        titleTextPaint.setAntiAlias(true);
        titleTextPaint.setColor(0xffffffff);
        titleTextPaint.setTextAlign(Align.CENTER);
        titleTextPaint.setTextSize(20f*mDips);
        titleTextPaint.setTypeface(Typeface.MONOSPACE);

        unitTextPaint = new TextPaint();
        unitTextPaint.setAntiAlias(true);
        unitTextPaint.setColor(0xff888888);
        unitTextPaint.setTextAlign(Align.CENTER);
        unitTextPaint.setTextSize(20f*mDips);
        unitTextPaint.setTypeface(Typeface.MONOSPACE);

    }

    ///////////////////////////////////////////////////////////////////////////////
    // Overridden methods
    ///////////////////////////////////////////////////////////////////////////////

    protected void onMeasure(int widthMeasureSpec, int heightMeasureSpec){
        super.onMeasure(widthMeasureSpec, heightMeasureSpec);
    }

    protected void onSizeChanged(int w, int h, int oldw, int oldh) {
        regenerateBackground();
    }

    public void onDraw(Canvas canvas){
        drawBackground(canvas);
        if(dataSource != null)
            drawCurve(canvas, dataSource);
    }

    ///////////////////////////////////////////////////////////////////////////////
    // Drawing methods
    ///////////////////////////////////////////////////////////////////////////////

    private void drawX(Canvas canvas){
        canvas.drawLine(mLeftSide, positionOfX, mRightSide, positionOfX, xAxisPaint);
        canvas.drawText(xUnitText, mRightSide -  unitTextPaint.measureText(xUnitText)/2, positionOfX - unitTextPaint.getTextSize()/2, unitTextPaint);
    }

    private void drawY(Canvas canvas){
        canvas.drawLine(positionOfY, mTopSide, positionOfY, mBottomSide, yAxisPaint);
        canvas.drawText(yUnitText, positionOfY + unitTextPaint.measureText(yUnitText)/2 + 4*mDips, mTopSide + (int) (unitTextPaint.getTextSize()/2), unitTextPaint);
    }

    private void drawTick(Canvas canvas){
        // No tick at this time
        // TODO decide how I want to put those ticks, if I want them
    }

    private void drawTitle(Canvas canvas){
        canvas.drawText(titleText, mMiddleX, mTopSide + (int) (titleTextPaint.getTextSize()/2), titleTextPaint);
    }

    /**
     * Read a buffer array of size greater than "windowSize" and create a window array out of it.
     * A curve is then drawn from this array using "windowSize" points, from left
     * to right.
     * @param canvas is a Canvas object on which the curve will be drawn.  Ensure the canvas is the
     * later drawn object at its position or you will not see your curve.
     * @param data is a float array of length > windowSize.  The floats must range between 0.0 and 1.0.
     * A value of 0.0 will be drawn at the bottom of the graph, while a value of 1.0 will be drawn at
     * the top of the graph.  The range is not tested, so you must ensure to pass proper values, or your
     * graph will look terrible.
     *      0.0  : draw at the bottom of the graph
     *      0.5  : draw in the middle of the graph
     *      1.0  : draw at the top of the graph
     */
    private void drawCurve(Canvas canvas, float[] data){

        // Create a reference value to determine the stepping between each points to be drawn
        float incrementX = (mRightSide-mLeftSide)/(float) windowSize;

        float incrementY = mBottomSide - mTopSide;

        // Prepare the array for the graph
        float[] source = prepareWindowArray(data);

        // Prepare the curve Path
        curve = new Path();
        // Move at the first point.
        curve.moveTo(mLeftSide, source[0]*incrementY);
        // Draw the remaining points of the curve
        for(int i = 1; i < windowSize; i++){
            curve.lineTo(mLeftSide + (i*incrementX), source[i] * incrementY);
        }

        canvas.drawPath(curve, curvePaint);
    }

    ///////////////////////////////////////////////////////////////////////////////
    // Intimate methods
    ///////////////////////////////////////////////////////////////////////////////

    /**
     * When asked to draw the background, this method will verify if a bitmap of the
     * background is available.  If not, it will regenerate one.  Then, it will draw
     * the background using this bitmap.  The use of a bitmap to draw the background
     * is to avoid unnecessary processing for static parts of the view.
     */
    private void drawBackground(Canvas canvas){
        if(background == null){
            regenerateBackground();
        }
        canvas.drawBitmap(background, 0, 0, backgroundPaint);
    }

    /**
     * Call this method to force the <i>GraphView</i> to redraw the cache of it's background,
     * using new properties if you changed them with <i>setupGraph()</i>.
     */
    public void regenerateBackground(){
        initConstants();
        try{
            initWindowSetting();
        } catch (IllegalArgumentException e){
            Log.e(TAG, "Could not initalize windows.", e);
            return;
        }
        if(background != null){
            background.recycle();
        }
        background = Bitmap.createBitmap(getWidth(), getHeight(), Bitmap.Config.ARGB_8888);
        Canvas backgroundCanvas = new Canvas(background);

        drawX(backgroundCanvas);
        drawY(backgroundCanvas);
        drawTick(backgroundCanvas);
        drawTitle(backgroundCanvas);

    }

    /**
     * Extract a window array from the data array, and reposition the windowStart
     * index for next iteration
     * @param data the array of data from which we get the window
     * @return an array of float that represent the window
     */
    private float[] prepareWindowArray(float[] data){
        // Prepare the source array for the graph.
        float[] source = new float[windowSize];

        // Copy the window from the data array into the source array
        for(int i = 0; i < windowSize; i++){
            if(windowStart+i < data.length)                         // If the windows holds within the data array
                source[i] = data[windowStart + i];                  // Simply copy the value in the source array
            else{                                                   // If the window goes beyond the data array
                source[i] = data[(windowStart + 1)%data.length];    // Loop at the beginning of the data array and copy from there
            }
        }
        // Reposition the buffer index
        windowStart = windowStart + windowSize;
        // If the index is beyond the end of the array
        if(windowStart >= data.length){
            windowStart = windowStart % data.length;
        }

        return source;
    }
}
Ну я бы для начала просто пытается перекроить все с кода и реальных данных dynalic. Только если это не достаточно быстро, вам нужно попробовать что-нибудь необычное, как прокрутка...
Если вам нужна фантазия, я бы попробовал что-то вроде этого.
Я бы нарисовал динамическую часть графика во вторичное растровое изображение, которое вы держите между кадрами, а не непосредственно к канвам. У меня не было бы фоновой динамической части графика в другом растровом изображении, которое только получает drawen при масштабировании и т. д.
в этом вторичном динамическом растровом изображении при отображении новых данных вам сначала нужно очистить старые данные, которые вы заменяете, вы делаете это, рисуя apropriate срез статического фонового растрового изображения поверх устаревших данных, таким образом, очищая его и получая фон хороший и свежий снова. Затем вам просто нужно нарисовать новый бит динамических данных. Фокус в том, что вы рисуете в этом втором растровом слева направо, а затем просто обернуть обратно налево в конце и начать все сначала.
получить от soncodary растровое изображение в ваш канкаса нарисовать растровое изображение на холст в двух частях. Старые данные справа от того, что вы только что добавили, должны быть нарисованы на левой части вашего окончательного холста, а новые данные должны быть нарисованы непосредственно справа от него.
для отправки данных круговой буфер был бы нормальной вещью для такого рода данных, где, как только он выходит из графика, вам все равно.