R интерполированный полярный контурный график
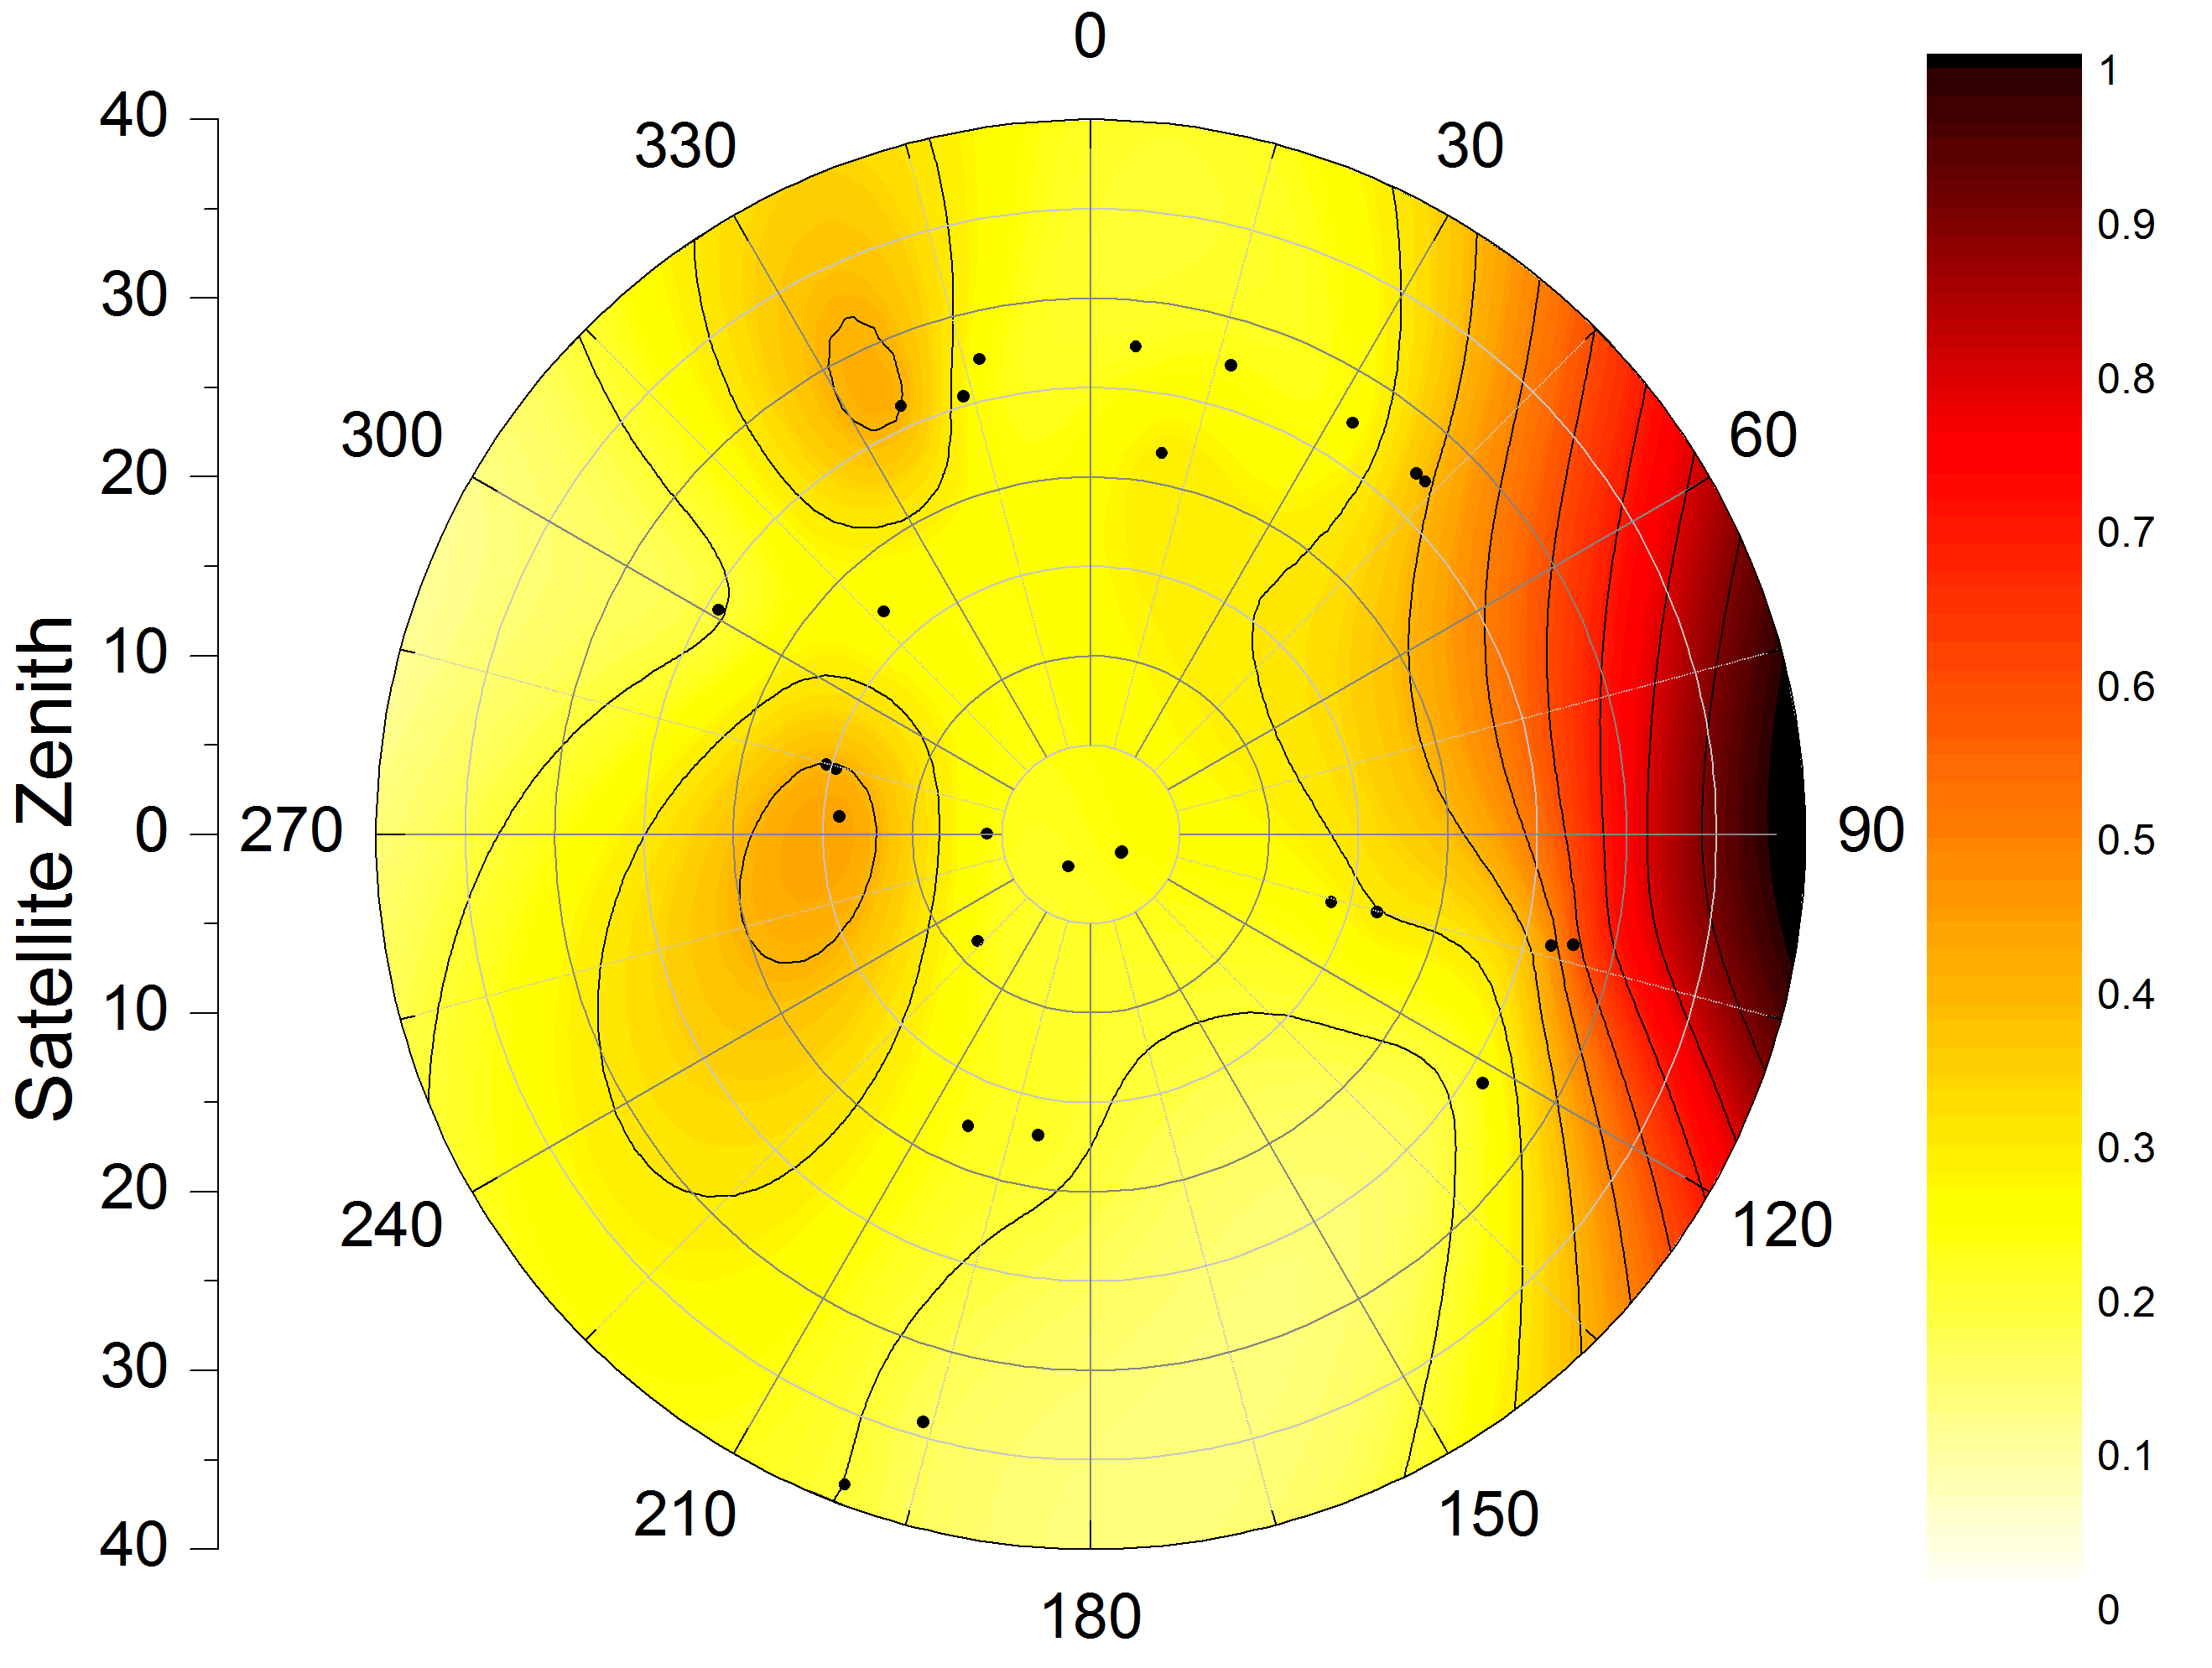
Я пытаюсь написать контурный полярный график в R из интерполированных точечных данных. Другими словами, у меня есть данные в полярных координатах со значением величины, которое я хотел бы построить и показать интерполированные значения. Я хотел бы массово производить участки, похожие на следующие (произведенные в OriginPro):
моя ближайшая попытка в R к этому моменту в основном:
### Convert polar -> cart
# ToDo #

### Dummy data
x = rnorm(20)
y = rnorm(20)
z = rnorm(20)

### Interpolate
library(akima)
tmp = interp(x,y,z)

### Plot interpolation
library(fields)
image.plot(tmp)

### ToDo ###
#Turn off all axis
#Plot polar axis ontop
, который производит что-то вроде:
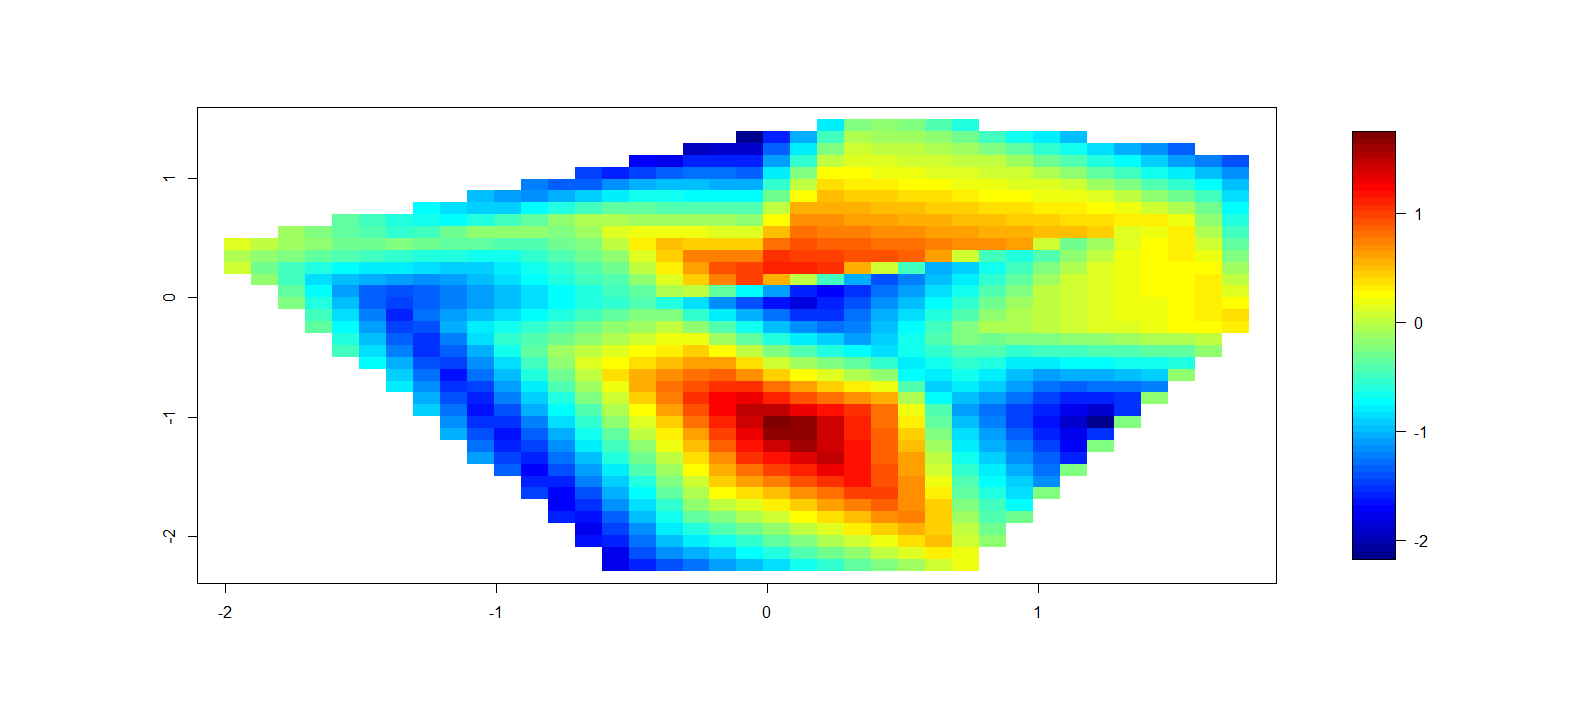
пока это очевидно, что это не будет конечным продуктом, это лучший способ создать контурные полярные участки в R?
Я не могу найти ничего по этой теме кроме архив списка рассылки дискуссия с 2008. Я думаю, что я не полностью посвящен использованию R для графиков (хотя у меня есть данные), но я против ручного создания. Итак, если есть другой язык с этой возможностью, пожалуйста, предложите его (я видел Python пример).
редактировать
Что касается предложения с использованием ggplot2 - я не могу получить процедуру geom_tile для построения интерполированных данных в polar_coordinates. Я включил код ниже, который иллюстрирует, где я нахожусь. Я могу построить оригинал в декартовом и Полярном, но я могу получить только интерполированные данные для построения в декартовом. Я могу построить точки интерполяции в polar с помощью geom_point, но я не могу расширить этот подход до geom_tile. Я только предполагал, что это связано с порядком данных - т. е. geom_tile ожидает отсортированных / упорядоченных данных - я пробовал каждую итерацию, которую я могу подумать о сортировке данных по восходящему / нисходящему азимуту и Зениту без изменений.
## Libs
library(akima)
library(ggplot2)

## Sample data in az/el(zenith)
tmp = seq(5,355,by=10)
geoms <- data.frame(az = tmp,
                    zen = runif(length(tmp)),
                    value = runif(length(tmp)))
geoms$az_rad = geoms$az*pi/180
## These points plot fine
ggplot(geoms)+geom_point(aes(az,zen,colour=value))+
    coord_polar()+
    scale_x_continuous(breaks=c(0,45,90,135,180,225,270,315,360),limits=c(0,360))+
    scale_colour_gradient(breaks=seq(0,1,by=.1),low="black",high="white")

## Need to interpolate - most easily done in cartesian
x = geoms$zen*sin(geoms$az_rad)
y = geoms$zen*cos(geoms$az_rad)
df.ptsc = data.frame(x=x,y=y,z=geoms$value)
intc = interp(x,y,geoms$value,
             xo=seq(min(x), max(x), length = 100),
             yo=seq(min(y), max(y), length = 100),linear=FALSE)
df.intc = data.frame(expand.grid(x=intc$x,y=intc$y),
               z=c(intc$z),value=cut((intc$z),breaks=seq(0,1,.1)))
## This plots fine in cartesian coords
ggplot(df.intc)+scale_x_continuous(limits=c(-1.1,1.1))+
                scale_y_continuous(limits=c(-1.1,1.1))+
                geom_point(data=df.ptsc,aes(x,y,colour=z))+
                scale_colour_gradient(breaks=seq(0,1,by=.1),low="white",high="red")
ggplot(df.intc)+geom_tile(aes(x,y,fill=z))+
                scale_x_continuous(limits=c(-1.1,1.1))+
                scale_y_continuous(limits=c(-1.1,1.1))+
                geom_point(data=df.ptsc,aes(x,y,colour=z))+
                scale_colour_gradient(breaks=seq(0,1,by=.1),low="white",high="red")

## Convert back to polar
int_az = atan2(df.intc$x,df.intc$y)
int_az = int_az*180/pi
int_az = unlist(lapply(int_az,function(x){if(x<0){x+360}else{x}}))
int_zen = sqrt(df.intc$x^2+df.intc$y^2)
df.intp = data.frame(az=int_az,zen=int_zen,z=df.intc$z,value=df.intc$value)
## Just to check
az = atan2(x,y)
az = az*180/pi
az = unlist(lapply(az,function(x){if(x<0){x+360}else{x}}))
zen = sqrt(x^2+y^2)
## The conversion looks correct [[az = geoms$az, zen = geoms$zen]]

## This plots the interpolated locations
ggplot(df.intp)+geom_point(aes(az,zen))+coord_polar()
## This doesn't track to geom_tile
ggplot(df.intp)+geom_tile(aes(az,zen,fill=value))+coord_polar()
Окончательные Результаты
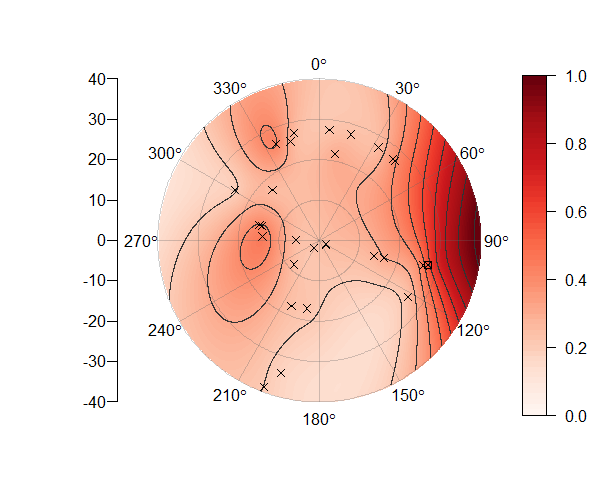
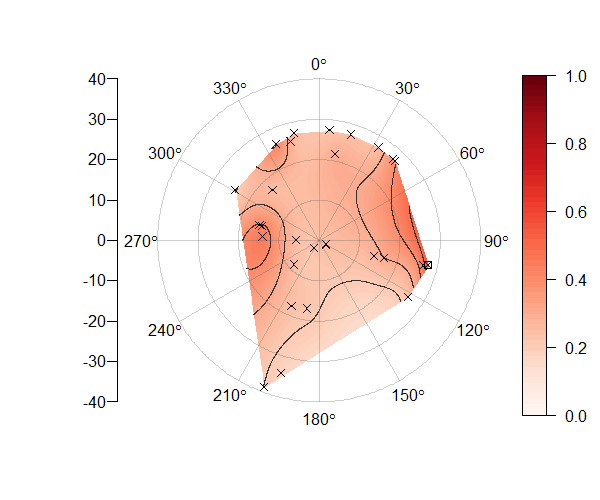
я, наконец, взял код из принятого ответа (основа графика) и обновил код. Я добавил метод интерполяции сплайнов тонкой пластины, возможность экстраполировать или нет, наложение точек данных и возможность делать непрерывные цвета или сегментированные цвета для интерполированной поверхности. См. примеры ниже.
PolarImageInterpolate <- function(
    ### Plotting data (in cartesian) - will be converted to polar space.
    x, y, z,
    ### Plot component flags
    contours=TRUE,   # Add contours to the plotted surface
    legend=TRUE,        # Plot a surface data legend?
    axes=TRUE,      # Plot axes?
    points=TRUE,        # Plot individual data points
    extrapolate=FALSE, # Should we extrapolate outside data points?
    ### Data splitting params for color scale and contours
    col_breaks_source = 1, # Where to calculate the color brakes from (1=data,2=surface)
                                                 # If you know the levels, input directly (i.e. c(0,1))
    col_levels = 10,    # Number of color levels to use - must match length(col) if
                                        #col specified separately
    col = rev(heat.colors(col_levels)),  # Colors to plot
    contour_breaks_source = 1, # 1=z data, 2=calculated surface data
                                                        # If you know the levels, input directly (i.e. c(0,1))
    contour_levels = col_levels+1, # One more contour break than col_levels (must be
                                                                # specified correctly if done manually
    ### Plotting params
    outer.radius = round_any(max(sqrt(x^2+y^2)),5,f=ceiling),
    circle.rads = pretty(c(0,outer.radius)), #Radius lines
    spatial_res=1000, #Resolution of fitted surface
    single_point_overlay=0, #Overlay "key" data point with square
                                                    #(0 = No, Other = number of pt)
    ### Fitting parameters
    interp.type = 1, #1 = linear, 2 = Thin plate spline
    lambda=0){ #Used only when interp.type = 2

minitics <- seq(-outer.radius, outer.radius, length.out = spatial_res)
# interpolate the data
    if (interp.type ==1 ){
    Interp <- akima:::interp(x = x, y = y, z = z,
                    extrap = extrapolate,
                    xo = minitics,
                    yo = minitics,
                    linear = FALSE)
    Mat <- Interp[[3]]
    }
    else if (interp.type == 2){
        library(fields)
        grid.list = list(x=minitics,y=minitics)
        t = Tps(cbind(x,y),z,lambda=lambda)
        tmp = predict.surface(t,grid.list,extrap=extrapolate)
        Mat = tmp$z
    }
    else {stop("interp.type value not valid")}

# mark cells outside circle as NA
markNA <- matrix(minitics, ncol = spatial_res, nrow = spatial_res)
Mat[!sqrt(markNA ^ 2 + t(markNA) ^ 2) < outer.radius] <- NA

    ### Set contour_breaks based on requested source
    if ((length(contour_breaks_source == 1)) & (contour_breaks_source[1] == 1)){
        contour_breaks = seq(min(z,na.rm=TRUE),max(z,na.rm=TRUE),
                            by=(max(z,na.rm=TRUE)-min(z,na.rm=TRUE))/(contour_levels-1))
    }
    else if ((length(contour_breaks_source == 1)) & (contour_breaks_source[1] == 2)){
        contour_breaks = seq(min(Mat,na.rm=TRUE),max(Mat,na.rm=TRUE),
                            by=(max(Mat,na.rm=TRUE)-min(Mat,na.rm=TRUE))/(contour_levels-1))
    }
    else if ((length(contour_breaks_source) == 2) & (is.numeric(contour_breaks_source))){
        contour_breaks = pretty(contour_breaks_source,n=contour_levels)
        contour_breaks = seq(contour_breaks_source[1],contour_breaks_source[2],
                            by=(contour_breaks_source[2]-contour_breaks_source[1])/(contour_levels-1))
    }
    else {stop("Invalid selection for "contour_breaks_source"")}

    ### Set color breaks based on requested source
    if ((length(col_breaks_source) == 1) & (col_breaks_source[1] == 1))
        {zlim=c(min(z,na.rm=TRUE),max(z,na.rm=TRUE))}
    else if ((length(col_breaks_source) == 1) & (col_breaks_source[1] == 2))
        {zlim=c(min(Mat,na.rm=TRUE),max(Mat,na.rm=TRUE))}
    else if ((length(col_breaks_source) == 2) & (is.numeric(col_breaks_source)))
        {zlim=col_breaks_source}
    else {stop("Invalid selection for "col_breaks_source"")}

# begin plot
    Mat_plot = Mat
    Mat_plot[which(Mat_plot<zlim[1])]=zlim[1]
    Mat_plot[which(Mat_plot>zlim[2])]=zlim[2]
image(x = minitics, y = minitics, Mat_plot , useRaster = TRUE, asp = 1, axes = FALSE, xlab = "", ylab = "", zlim = zlim, col = col)

# add contours if desired
if (contours){
    CL <- contourLines(x = minitics, y = minitics, Mat, levels = contour_breaks)
    A <- lapply(CL, function(xy){
                lines(xy$x, xy$y, col = gray(.2), lwd = .5)
            })
}
    # add interpolated point if desired
    if (points){
            points(x,y,pch=4)
}
    # add overlay point (used for trained image marking) if desired
    if (single_point_overlay!=0){
            points(x[single_point_overlay],y[single_point_overlay],pch=0)
    }

# add radial axes if desired
if (axes){
    # internals for axis markup
    RMat <- function(radians){
        matrix(c(cos(radians), sin(radians), -sin(radians), cos(radians)), ncol = 2)
    }

    circle <- function(x, y, rad = 1, nvert = 500){
        rads <- seq(0,2*pi,length.out = nvert)
        xcoords <- cos(rads) * rad + x
        ycoords <- sin(rads) * rad + y
        cbind(xcoords, ycoords)
    }

    # draw circles
    if (missing(circle.rads)){
        circle.rads <- pretty(c(0,outer.radius))
    }

    for (i in circle.rads){
        lines(circle(0, 0, i), col = "#66666650")
    }

    # put on radial spoke axes:
    axis.rads <- c(0, pi / 6, pi / 3, pi / 2, 2 * pi / 3, 5 * pi / 6)
    r.labs <- c(90, 60, 30, 0, 330, 300)
    l.labs <- c(270, 240, 210, 180, 150, 120)

    for (i in 1:length(axis.rads)){
        endpoints <- zapsmall(c(RMat(axis.rads[i]) %*% matrix(c(1, 0, -1, 0) * outer.radius,ncol = 2)))
        segments(endpoints[1], endpoints[2], endpoints[3], endpoints[4], col = "#66666650")
        endpoints <- c(RMat(axis.rads[i]) %*% matrix(c(1.1, 0, -1.1, 0) * outer.radius, ncol = 2))
        lab1 <- bquote(.(r.labs[i]) * degree)
        lab2 <- bquote(.(l.labs[i]) * degree)
        text(endpoints[1], endpoints[2], lab1, xpd = TRUE)
        text(endpoints[3], endpoints[4], lab2, xpd = TRUE)
    }

    axis(2, pos = -1.25 * outer.radius, at = sort(union(circle.rads,-circle.rads)), labels = NA)
    text( -1.26 * outer.radius, sort(union(circle.rads, -circle.rads)),sort(union(circle.rads, -circle.rads)), xpd = TRUE, pos = 2)
}

# add legend if desired
# this could be sloppy if there are lots of breaks, and that's why it's optional.
# another option would be to use fields:::image.plot(), using only the legend.
# There's an example for how to do so in its documentation
    if (legend){
        library(fields)
        image.plot(legend.only=TRUE, smallplot=c(.78,.82,.1,.8), col=col, zlim=zlim)
    # ylevs <- seq(-outer.radius, outer.radius, length = contour_levels+ 1)
    # #ylevs <- seq(-outer.radius, outer.radius, length = length(contour_breaks))
            # rect(1.2 * outer.radius, ylevs[1:(length(ylevs) - 1)], 1.3 * outer.radius, ylevs[2:length(ylevs)], col = col, border = NA, xpd = TRUE)
    # rect(1.2 * outer.radius, min(ylevs), 1.3 * outer.radius, max(ylevs), border = "#66666650", xpd = TRUE)
    # text(1.3 * outer.radius, ylevs[seq(1,length(ylevs),length.out=length(contour_breaks))],round(contour_breaks, 1), pos = 4, xpd = TRUE)
    }
}
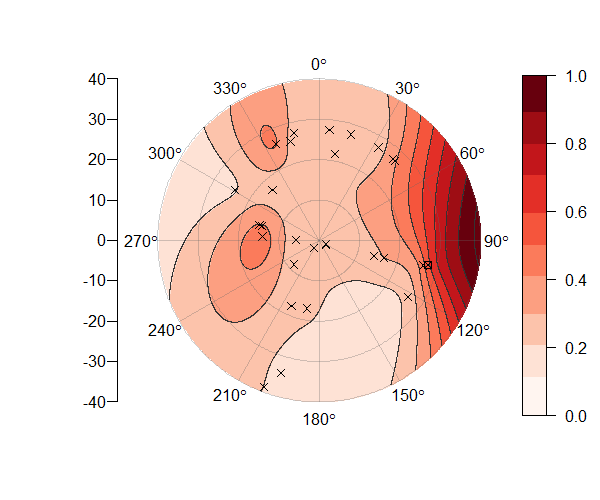
2 ответов
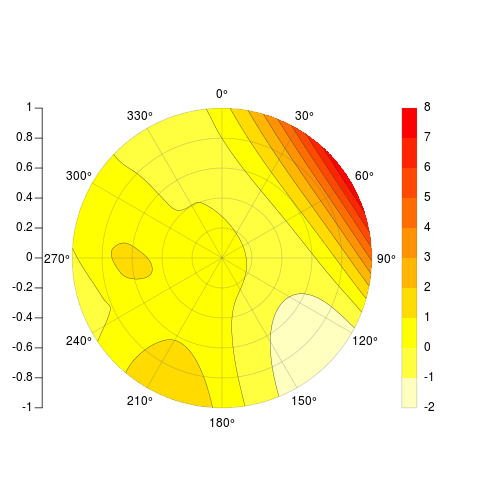
[[основные изменения]] Я, наконец, смог добавить контурные линии к моей первоначальной попытке, но поскольку две стороны исходной матрицы, которая искажается, фактически не касаются, линии не совпадают между 360 и 0 градусами. Поэтому я полностью переосмыслил проблему, но оставил исходный пост ниже, потому что все еще было здорово построить матрицу таким образом. Функция, которую я публикую сейчас, принимает x, y, z и несколько дополнительных аргументов и выплевывает что-то чертовски похожее на желаемое примеры, радиальные оси, легенда, контурные линии и все:
    PolarImageInterpolate <- function(x, y, z, outer.radius = 1,
            breaks, col, nlevels = 20, contours = TRUE, legend = TRUE,
            axes = TRUE, circle.rads = pretty(c(0,outer.radius))){

        minitics <- seq(-outer.radius, outer.radius, length.out = 1000)
        # interpolate the data
        Interp <- akima:::interp(x = x, y = y, z = z,
                extrap = TRUE,
                xo = minitics,
                yo = minitics,
                linear = FALSE)
        Mat <- Interp[[3]]

        # mark cells outside circle as NA
        markNA <- matrix(minitics, ncol = 1000, nrow = 1000)
        Mat[!sqrt(markNA ^ 2 + t(markNA) ^ 2) < outer.radius] <- NA

        # sort out colors and breaks:
        if (!missing(breaks) & !missing(col)){
            if (length(breaks) - length(col) != 1){
                stop("breaks must be 1 element longer than cols")
            }
        }
        if (missing(breaks) & !missing(col)){
            breaks <- seq(min(Mat,na.rm = TRUE), max(Mat, na.rm = TRUE), length = length(col) + 1)
            nlevels <- length(breaks) - 1
        }
        if (missing(col) & !missing(breaks)){
            col <- rev(heat.colors(length(breaks) - 1))
            nlevels <- length(breaks) - 1
        }
        if (missing(breaks) & missing(col)){
            breaks <- seq(min(Mat,na.rm = TRUE), max(Mat, na.rm = TRUE), length = nlevels + 1)
            col <- rev(heat.colors(nlevels))
        }

        # if legend desired, it goes on the right and some space is needed
        if (legend) {
            par(mai = c(1,1,1.5,1.5))
        }

        # begin plot
        image(x = minitics, y = minitics, t(Mat), useRaster = TRUE, asp = 1,
            axes = FALSE, xlab = "", ylab = "", col = col, breaks = breaks)

        # add contours if desired
        if (contours){
            CL <- contourLines(x = minitics, y = minitics, t(Mat), levels = breaks)
            A <- lapply(CL, function(xy){
                        lines(xy$x, xy$y, col = gray(.2), lwd = .5)
                    })
        }

        # add radial axes if desired
        if (axes){
            # internals for axis markup
            RMat <- function(radians){
                matrix(c(cos(radians), sin(radians), -sin(radians), cos(radians)), ncol = 2)
            }

            circle <- function(x, y, rad = 1, nvert = 500){
                rads <- seq(0,2*pi,length.out = nvert)
                xcoords <- cos(rads) * rad + x
                ycoords <- sin(rads) * rad + y
                cbind(xcoords, ycoords)
            }

            # draw circles
            if (missing(circle.rads)){
                circle.rads <- pretty(c(0,outer.radius))
            }

            for (i in circle.rads){
                lines(circle(0, 0, i), col = "#66666650")
            }

            # put on radial spoke axes:
            axis.rads <- c(0, pi / 6, pi / 3, pi / 2, 2 * pi / 3, 5 * pi / 6)
            r.labs <- c(90, 60, 30, 0, 330, 300)
            l.labs <- c(270, 240, 210, 180, 150, 120)

            for (i in 1:length(axis.rads)){
                endpoints <- zapsmall(c(RMat(axis.rads[i]) %*% matrix(c(1, 0, -1, 0) * outer.radius,ncol = 2)))
                segments(endpoints[1], endpoints[2], endpoints[3], endpoints[4], col = "#66666650")
                endpoints <- c(RMat(axis.rads[i]) %*% matrix(c(1.1, 0, -1.1, 0) * outer.radius, ncol = 2))
                lab1 <- bquote(.(r.labs[i]) * degree)
                lab2 <- bquote(.(l.labs[i]) * degree)
                text(endpoints[1], endpoints[2], lab1, xpd = TRUE)
                text(endpoints[3], endpoints[4], lab2, xpd = TRUE)
            }
            axis(2, pos = -1.2 * outer.radius, at = sort(union(circle.rads,-circle.rads)), labels = NA)
            text( -1.21 * outer.radius, sort(union(circle.rads, -circle.rads)),sort(union(circle.rads, -circle.rads)), xpd = TRUE, pos = 2)
        }

        # add legend if desired
        # this could be sloppy if there are lots of breaks, and that's why it's optional.
        # another option would be to use fields:::image.plot(), using only the legend.
        # There's an example for how to do so in its documentation
        if (legend){
            ylevs <- seq(-outer.radius, outer.radius, length = nlevels + 1)
            rect(1.2 * outer.radius, ylevs[1:(length(ylevs) - 1)], 1.3 * outer.radius, ylevs[2:length(ylevs)], col = col, border = NA, xpd = TRUE)
            rect(1.2 * outer.radius, min(ylevs), 1.3 * outer.radius, max(ylevs), border = "#66666650", xpd = TRUE)
            text(1.3 * outer.radius, ylevs,round(breaks, 1), pos = 4, xpd = TRUE)
        }
    }

    # Example
    set.seed(10)
    x <- rnorm(20)
    y <- rnorm(20)
    z <- rnorm(20)
    PolarImageInterpolate(x,y,z, breaks = seq(-2,8,by = 1))
код доступен здесь: https://gist.github.com/2893780
[[мой первоначальный ответ следует]]
Я думал, что ваш вопрос будет очень познавательно для меня, поэтому я принял вызов и придумал следующую неполной функции. Он работает аналогично image(), хочет матрицу в качестве основного входа и выплевывает что-то похожее на ваш пример сверху минус контурные линии.
[[Я отредактировал код 6 июня, заметив, что он не строится в порядке, который я утверждал. Зафиксированный. В настоящее время работает над контурными линиями и легендой.]]
    # arguments:

    # Mat, a matrix of z values as follows:
    # leftmost edge of first column = 0 degrees, rightmost edge of last column = 360 degrees
    # columns are distributed in cells equally over the range 0 to 360 degrees, like a grid prior to transform
    # first row is innermost circle, last row is outermost circle

    # outer.radius, By default everything scaled to unit circle
    # ppa: points per cell per arc. If your matrix is little, make it larger for a nice curve
    # cols: color vector. default = rev(heat.colors(length(breaks)-1))
    # breaks: manual breaks for colors. defaults to seq(min(Mat),max(Mat),length=nbreaks)
    # nbreaks: how many color levels are desired?
    # axes: should circular and radial axes be drawn? radial axes are drawn at 30 degree intervals only- this could be made more flexible.
    # circle.rads: at which radii should circles be drawn? defaults to pretty(((0:ncol(Mat)) / ncol(Mat)) * outer.radius)

    # TODO: add color strip legend.

    PolarImagePlot <- function(Mat, outer.radius = 1, ppa = 5, cols, breaks, nbreaks = 51, axes = TRUE, circle.rads){

        # the image prep
        Mat      <- Mat[, ncol(Mat):1]
        radii    <- ((0:ncol(Mat)) / ncol(Mat)) * outer.radius

        # 5 points per arc will usually do
        Npts     <- ppa
        # all the angles for which a vertex is needed
        radians  <- 2 * pi * (0:(nrow(Mat) * Npts)) / (nrow(Mat) * Npts) + pi / 2
        # matrix where each row is the arc corresponding to a cell
        rad.mat  <- matrix(radians[-length(radians)], ncol = Npts, byrow = TRUE)[1:nrow(Mat), ]
        rad.mat  <- cbind(rad.mat, rad.mat[c(2:nrow(rad.mat), 1), 1])

        # the x and y coords assuming radius of 1
        y0 <- sin(rad.mat)
        x0 <- cos(rad.mat)

        # dimension markers
        nc <- ncol(x0)
        nr <- nrow(x0)
        nl <- length(radii)

        # make a copy for each radii, redimension in sick ways
        x1 <- aperm( x0 %o% radii, c(1, 3, 2))
        # the same, but coming back the other direction to close the polygon
        x2 <- x1[, , nc:1]
        #now stick together
        x.array <- abind:::abind(x1[, 1:(nl - 1), ], x2[, 2:nl, ], matrix(NA, ncol = (nl - 1), nrow = nr), along = 3)
        # final product, xcoords, is a single vector, in order,
        # where all the x coordinates for a cell are arranged
        # clockwise. cells are separated by NAs- allows a single call to polygon()
        xcoords <- aperm(x.array, c(3, 1, 2))
        dim(xcoords) <- c(NULL)
        # repeat for y coordinates
        y1 <- aperm( y0 %o% radii,c(1, 3, 2))
        y2 <- y1[, , nc:1]
        y.array <- abind:::abind(y1[, 1:(length(radii) - 1), ], y2[, 2:length(radii), ], matrix(NA, ncol = (length(radii) - 1), nrow = nr), along = 3)
        ycoords <- aperm(y.array, c(3, 1, 2))
        dim(ycoords) <- c(NULL)

        # sort out colors and breaks:
        if (!missing(breaks) & !missing(cols)){
            if (length(breaks) - length(cols) != 1){
                stop("breaks must be 1 element longer than cols")
            }
        }
        if (missing(breaks) & !missing(cols)){
            breaks <- seq(min(Mat,na.rm = TRUE), max(Mat, na.rm = TRUE), length = length(cols) + 1)
        }
        if (missing(cols) & !missing(breaks)){
            cols <- rev(heat.colors(length(breaks) - 1))
        }
        if (missing(breaks) & missing(cols)){
            breaks <- seq(min(Mat,na.rm = TRUE), max(Mat, na.rm = TRUE), length = nbreaks)
            cols <- rev(heat.colors(length(breaks) - 1))
        }

        # get a color for each cell. Ugly, but it gets them in the right order
        cell.cols <- as.character(cut(as.vector(Mat[nrow(Mat):1,ncol(Mat):1]), breaks = breaks, labels = cols))

        # start empty plot
        plot(NULL, type = "n", ylim = c(-1, 1) * outer.radius, xlim = c(-1, 1) * outer.radius, asp = 1, axes = FALSE, xlab = "", ylab = "")
        # draw polygons with no borders:
        polygon(xcoords, ycoords, col = cell.cols, border = NA)

        if (axes){

            # a couple internals for axis markup.

            RMat <- function(radians){
                matrix(c(cos(radians), sin(radians), -sin(radians), cos(radians)), ncol = 2)
            }

            circle <- function(x, y, rad = 1, nvert = 500){
                rads <- seq(0,2*pi,length.out = nvert)
                xcoords <- cos(rads) * rad + x
                ycoords <- sin(rads) * rad + y
                cbind(xcoords, ycoords)
            }
            # draw circles
            if (missing(circle.rads)){
                circle.rads <- pretty(radii)
            }
            for (i in circle.rads){
                lines(circle(0, 0, i), col = "#66666650")
            }

            # put on radial spoke axes:
            axis.rads <- c(0, pi / 6, pi / 3, pi / 2, 2 * pi / 3, 5 * pi / 6)
            r.labs <- c(90, 60, 30, 0, 330, 300)
            l.labs <- c(270, 240, 210, 180, 150, 120)

            for (i in 1:length(axis.rads)){
                endpoints <- zapsmall(c(RMat(axis.rads[i]) %*% matrix(c(1, 0, -1, 0) * outer.radius,ncol = 2)))
                segments(endpoints[1], endpoints[2], endpoints[3], endpoints[4], col = "#66666650")
                endpoints <- c(RMat(axis.rads[i]) %*% matrix(c(1.1, 0, -1.1, 0) * outer.radius, ncol = 2))
                lab1 <- bquote(.(r.labs[i]) * degree)
                lab2 <- bquote(.(l.labs[i]) * degree)
                text(endpoints[1], endpoints[2], lab1, xpd = TRUE)
                text(endpoints[3], endpoints[4], lab2, xpd = TRUE)
            }
            axis(2, pos = -1.2 * outer.radius, at = sort(union(circle.rads,-circle.rads)))
        }
        invisible(list(breaks = breaks, col = cols))
    }
Я не знаю, как правильно интерполировать по полярной поверхности, поэтому, предполагая, что вы можете достичь этого и получить свои данные в матрицу, эта функция получит ее для вас. Каждая ячейка рисуется, как с image(), но внутренние из них крошечные. Вот пример:
    set.seed(1)
    x <- runif(20, min = 0, max = 360)
    y <- runif(20, min = 0, max = 40)
    z <- rnorm(20)

    Interp <- akima:::interp(x = x, y = y, z = z,
            extrap = TRUE,
            xo = seq(0, 360, length.out = 300),
            yo = seq(0, 40, length.out = 100),
            linear = FALSE)
    Mat <- Interp[[3]]

    PolarImagePlot(Mat)
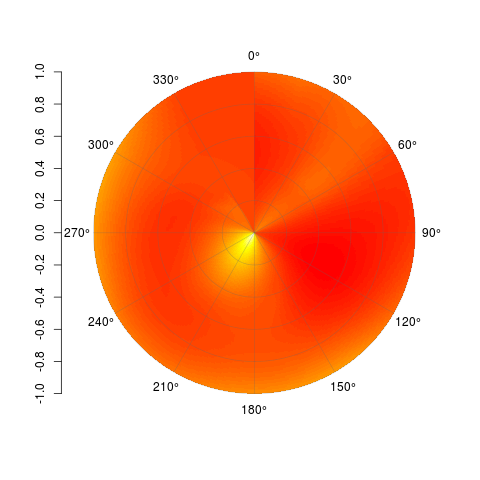
во что бы то ни стало, не стесняйтесь изменять это и делать с этим, что хотите. Код доступен на Github здесь:https://gist.github.com/2877281
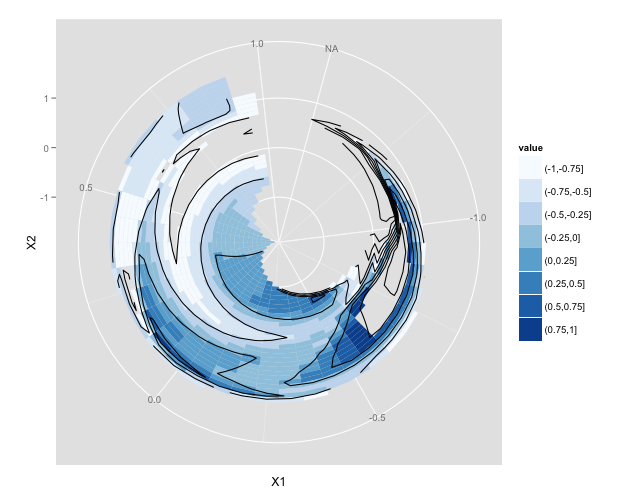
Целевого Участка
Пример Кода
library(akima)
library(ggplot2)

x = rnorm(20)
y = rnorm(20)
z = rnorm(20)

t. = interp(x,y,z)
t.df <- data.frame(t.)

gt <- data.frame( expand.grid(X1=t.$x,
                              X2=t.$y),
                  z=c(t.$z),
                  value=cut(c(t.$z),
                            breaks=seq(-1,1,0.25)))

p <- ggplot(gt) +
    geom_tile(aes(X1,X2,fill=value)) +
    geom_contour(aes(x=X1,y=X2,z=z), colour="black") +
    coord_polar()
p <- p + scale_fill_brewer()
p
ggplot2 затем имеет много вариантов для изучения цветовых шкал re, аннотаций и т. д. но это должно помочь тебе начать.
кредит этот ответ Андри Де Фриза это привело меня к этому решению.
