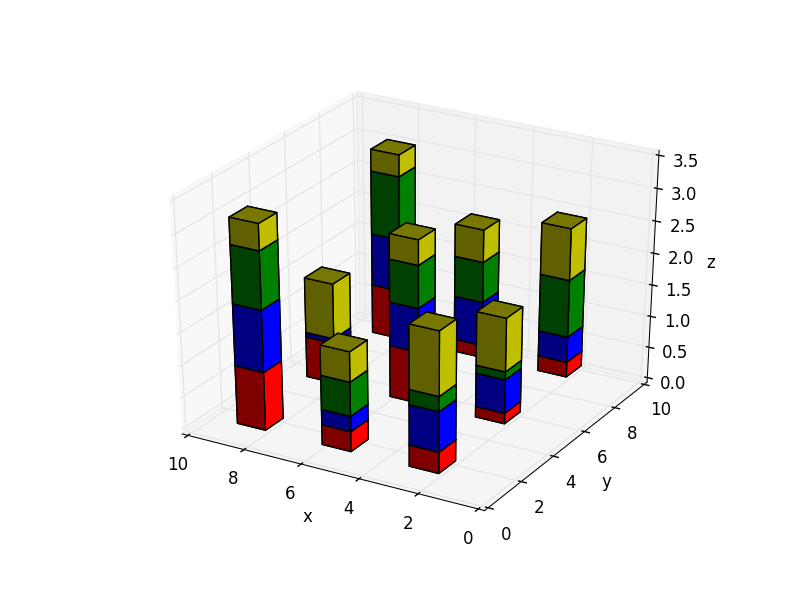
Штабелированная 3D гистограмма с matplotlib
Я работал над простой 3D-гистограммой, используя следующий код:
from mpl_toolkits.mplot3d import Axes3D
import matplotlib.pyplot as plt
import numpy as np

fig = plt.figure()
ax = fig.add_subplot(111, projection = "3d")

ax.set_xlabel("x")
ax.set_ylabel("y")
ax.set_zlabel("z")
ax.set_xlim3d(0,10)
ax.set_ylim3d(0,10)
ax.set_zlim3d(0,2)

xpos = [2,5,8,2,5,8,2,5,8]
ypos = [1,1,1,5,5,5,9,9,9]
zpos = np.zeros(9)

dx = np.ones(9)
dy = np.ones(9)
dz = np.ones(9)

ax.bar3d(xpos, ypos, zpos, dx, dy, dz)
plt.gca().invert_xaxis()
plt.show()
думая об этом просто как о тесте, все кажется ясным до сих пор. Мне просто интересно, как я могу построить каждый из этих 9 баров в штабелированном виде, так что, например, каждый бар разделен на 4 части, которые составляют весь бар.
в основном, я думаю сделать это на пути примера здесь.
но вместо 2 стеков я хочу иметь 4. Любые идеи, как исходить из какой я теперь? Каждый намек будет оценен по достоинству.
спасибо!
edit: если я хочу реализовать заданные значения для каждого сложенного бара, e.g:
...
z = [np.array([ 0.2, 0.6, 0.3, 0.6, 0.4, 0.3, 0.8, 0.5,  0.7]),
     np.array([ 0.8, 0.4, 0.5, 0.2, 0.8, 0.7, 0.4, 0.2,  0.9]),
     np.array([ 0.1, 0.2, 0.4, 0.4, 0.2, 0.6, 0.3, 0.6,  0.9]),
     np.array([ 0.9, 0.5, 0.7, 0.2, 0.5, 0.6, 0.7, 0.9,  0.7])]
dz = [z for i in range(4)]
...
это, похоже, не работает, и я не знаю, почему?
1 ответов
чтобы сделать штабелированный 3D-График, вы можете накопить свой dz значения и использовать их в качестве базы для каждого следующего бара. Вот пример:
from mpl_toolkits.mplot3d import Axes3D
import matplotlib.pyplot as plt
import numpy as np

fig = plt.figure()
ax = fig.add_subplot(111, projection = "3d")

ax.set_xlabel("x")
ax.set_ylabel("y")
ax.set_zlabel("z")
ax.set_xlim3d(0,10)
ax.set_ylim3d(0,10)

xpos = [2,5,8,2,5,8,2,5,8]
ypos = [1,1,1,5,5,5,9,9,9]
zpos = np.zeros(9)

dx = np.ones(9)
dy = np.ones(9)
dz = [np.random.random(9) for i in range(4)]  # the heights of the 4 bar sets

_zpos = zpos   # the starting zpos for each bar
colors = ['r', 'b', 'g', 'y']
for i in range(4):
    ax.bar3d(xpos, ypos, _zpos, dx, dy, dz[i], color=colors[i])
    _zpos += dz[i]    # add the height of each bar to know where to start the next

plt.gca().invert_xaxis()
plt.show()

