Вертикальная гистограмма в Python и Matplotlib
Как я могу сделать вертикальную гистограмму. Есть ли какой-либо вариант для этого или он должен быть построен с нуля? Я хочу, чтобы верхний график выглядел как нижний, но на вертикальной оси!
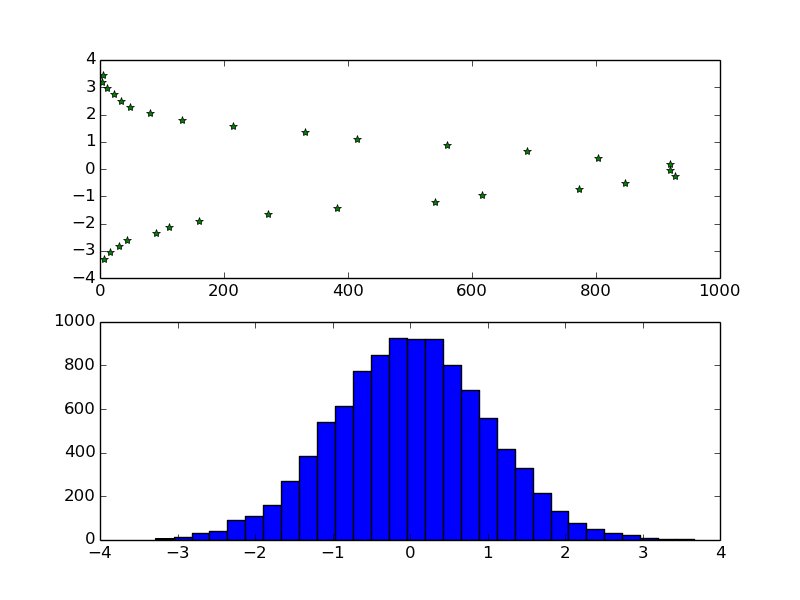
from matplotlib import pyplot as plt
import numpy as np
sample=np.random.normal(size=10000)
vert_hist=np.histogram(sample,bins=30)
ax1=plt.subplot(2,1,1)
ax1.plot(vert_hist[0],vert_hist[1][:-1],'*g')

ax2=plt.subplot(2,1,2)
ax2.hist(sample,bins=30)
plt.show()
2 ответов
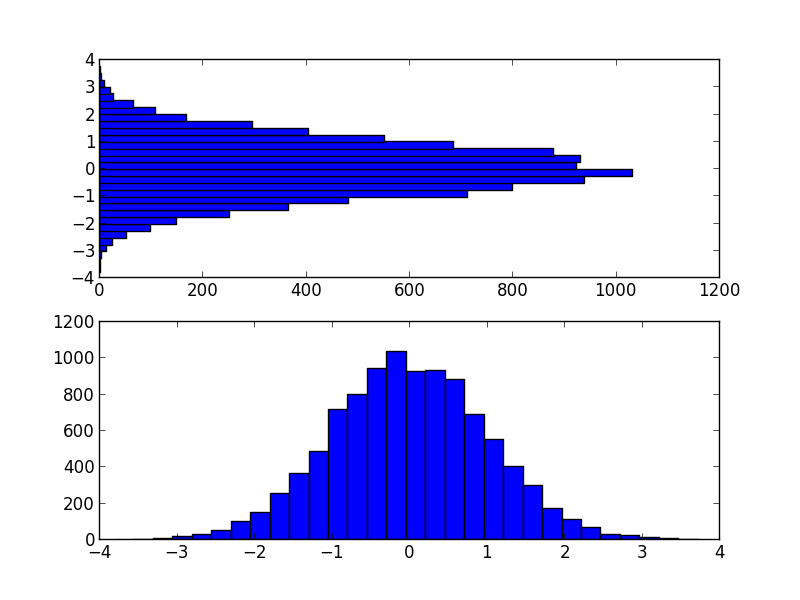
использовать orientation="horizontal" на ax.hist:
from matplotlib import pyplot as plt
import numpy as np

sample = np.random.normal(size=10000)

vert_hist = np.histogram(sample, bins=30)
ax1 = plt.subplot(2, 1, 1)
ax1.plot(vert_hist[0], vert_hist[1][:-1], '*g')

ax2 = plt.subplot(2, 1, 2)
ax2.hist(sample, bins=30, orientation="horizontal");
plt.show()
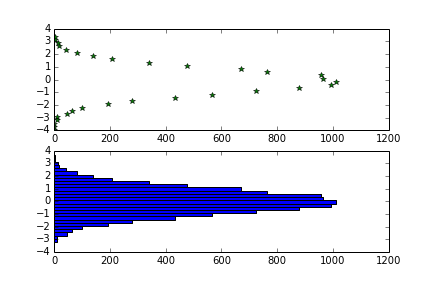
просто использовать barh() на участке:
import math
from matplotlib import pyplot as plt
import numpy as np
sample=np.random.normal(size=10000)
vert_hist=np.histogram(sample,bins=30)

# Compute height of plot.
height = math.ceil(max(vert_hist[1])) - math.floor(min(vert_hist[1]))

# Compute height of each horizontal bar.
height = height/len(vert_hist[0])

ax1=plt.subplot(2,1,1)
ax1.barh(vert_hist[1][:-1],vert_hist[0], height=height)

ax2=plt.subplot(2,1,2)
ax2.hist(sample,bins=30)
plt.show()