Значение курсора Matplotlib с двумя осями
Я twinx() чтобы получить две оси y на участке. Тем не менее, я хотел бы, чтобы панель навигации сообщала координаты y первой оси. Кажется, по умолчанию он сообщает положение второй оси. Как изменить его, чтобы сообщить о первой оси, или еще лучше, сообщить о обоих?
1 ответов
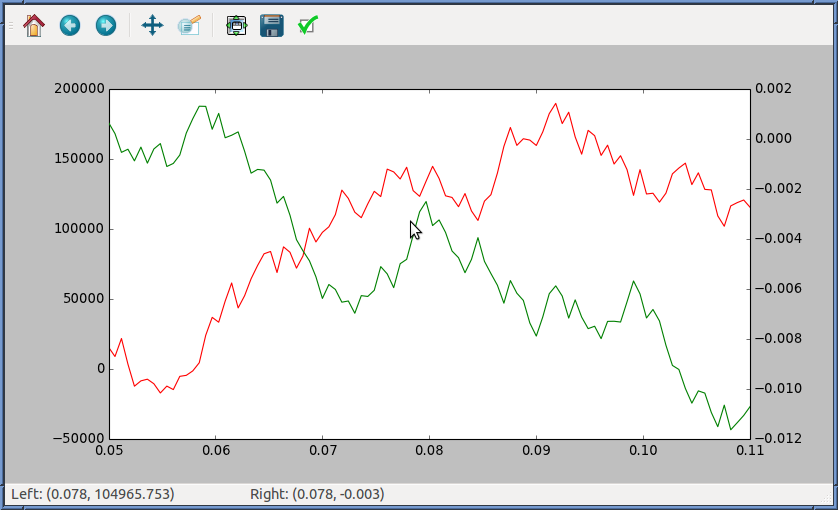
Дана помощь из ответов tcaswell (здесь и здесь), вы можете изменить трекер для отображения координат относительно обеих осей, как это:
import numpy as np
import matplotlib.pyplot as plt
import matplotlib.cm as cm

def make_format(current, other):
    # current and other are axes
    def format_coord(x, y):
        # x, y are data coordinates
        # convert to display coords
        display_coord = current.transData.transform((x,y))
        inv = other.transData.inverted()
        # convert back to data coords with respect to ax
        ax_coord = inv.transform(display_coord)
        coords = [ax_coord, (x, y)]
        return ('Left: {:<40}    Right: {:<}'
                .format(*['({:.3f}, {:.3f})'.format(x, y) for x,y in coords]))
    return format_coord

np.random.seed(6)
numdata = 100
t = np.linspace(0.05, 0.11, numdata)
y1 = np.cumsum(np.random.random(numdata) - 0.5) * 40000
y2 = np.cumsum(np.random.random(numdata) - 0.5) * 0.002

fig = plt.figure()

ax1 = fig.add_subplot(111)
ax2 = ax1.twinx()

ax2.format_coord = make_format(ax2, ax1)

ax1.plot(t, y1, 'r-', label='y1')
ax2.plot(t, y2, 'g-', label='y2')

plt.show()
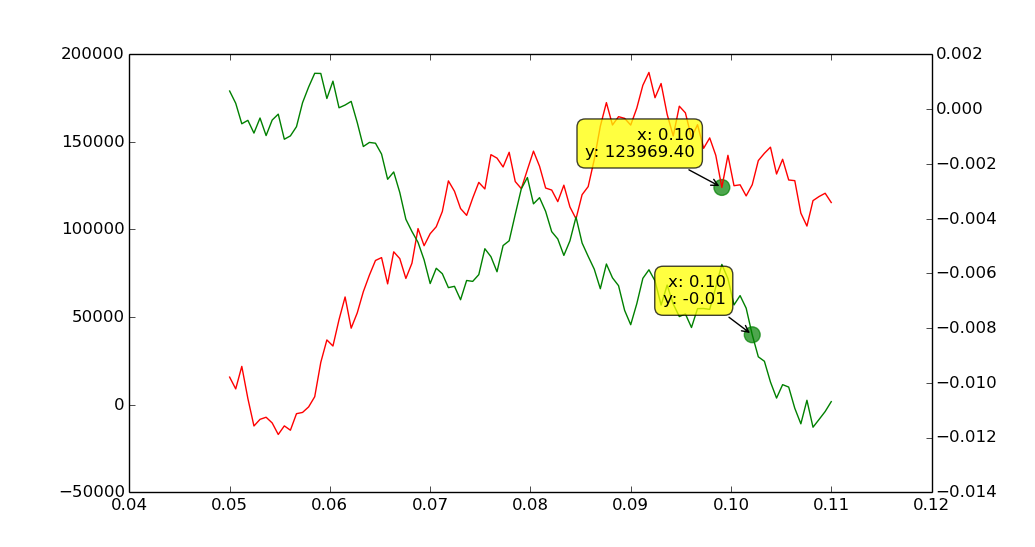
альтернативно, если у вас есть scipy, вы можете использовать FollowDotCursor, который будет аннотировать точку данных, ближайшую к курсору. Сделанное таким образом, глаза пользователя не должны двигаться далеко от графика, чтобы найти координаты данных. Сверх того, его можно приложить к больше чем два художника (просто добавьте FollowDotCursor для каждой линии, точечной диаграммы, гистограммы и т. д.).
Это также более точно, так как окно аннотации показывает значения ближайшей точки данных, а не просто координаты курсора в координатах данных.
import numpy as np
import matplotlib.pyplot as plt
import matplotlib.cm as cm
import scipy.spatial as spatial

def fmt(x, y):
    return 'x: {x:0.2f}\ny: {y:0.2f}'.format(x=x, y=y)

class FollowDotCursor(object):
    """Display the x,y location of the nearest data point.
    https://stackoverflow.com/a/4674445/190597 (Joe Kington)
    https://stackoverflow.com/a/20637433/190597 (unutbu)
    """
    def __init__(self, ax, x, y, formatter=fmt, offsets=(-20, 20)):
        try:
            x = np.asarray(x, dtype='float')
        except (TypeError, ValueError):
            x = np.asarray(mdates.date2num(x), dtype='float')
        y = np.asarray(y, dtype='float')
        mask = ~(np.isnan(x) | np.isnan(y))
        x = x[mask]
        y = y[mask]
        self._points = np.column_stack((x, y))
        self.offsets = offsets
        y = y[np.abs(y - y.mean()) <= 3 * y.std()]
        self.scale = x.ptp()
        self.scale = y.ptp() / self.scale if self.scale else 1
        self.tree = spatial.cKDTree(self.scaled(self._points))
        self.formatter = formatter
        self.ax = ax
        self.fig = ax.figure
        self.ax.xaxis.set_label_position('top')
        self.dot = ax.scatter(
            [x.min()], [y.min()], s=130, color='green', alpha=0.7)
        self.annotation = self.setup_annotation()
        plt.connect('motion_notify_event', self)

    def scaled(self, points):
        points = np.asarray(points)
        return points * (self.scale, 1)

    def __call__(self, event):
        ax = self.ax
        # event.inaxes is always the current axis. If you use twinx, ax could be
        # a different axis.
        if event.inaxes == ax:
            x, y = event.xdata, event.ydata
        elif event.inaxes is None:
            return
        else:
            inv = ax.transData.inverted()
            x, y = inv.transform([(event.x, event.y)]).ravel()
        annotation = self.annotation
        x, y = self.snap(x, y)
        annotation.xy = x, y
        annotation.set_text(self.formatter(x, y))
        self.dot.set_offsets((x, y))
        event.canvas.draw()

    def setup_annotation(self):
        """Draw and hide the annotation box."""
        annotation = self.ax.annotate(
            '', xy=(0, 0), ha = 'right',
            xytext = self.offsets, textcoords = 'offset points', va = 'bottom',
            bbox = dict(
                boxstyle='round,pad=0.5', fc='yellow', alpha=0.75),
            arrowprops = dict(
                arrowstyle='->', connectionstyle='arc3,rad=0'))
        return annotation

    def snap(self, x, y):
        """Return the value in self.tree closest to x, y."""
        dist, idx = self.tree.query(self.scaled((x, y)), k=1, p=1)
        try:
            return self._points[idx]
        except IndexError:
            # IndexError: index out of bounds
            return self._points[0]


np.random.seed(6)
numdata = 100
t = np.linspace(0.05, 0.11, numdata)
y1 = np.cumsum(np.random.random(numdata) - 0.5) * 40000
y2 = np.cumsum(np.random.random(numdata) - 0.5) * 0.002

fig = plt.figure()
ax1 = fig.add_subplot(111)
ax2 = ax1.twinx()

ax1.plot(t, y1, 'r-', label='y1')
ax2.plot(t, y2, 'g-', label='y2')

cursor1 = FollowDotCursor(ax1, t, y1)
cursor2 = FollowDotCursor(ax2, t, y2)
plt.show()