Как построить 2 Сиборн бок о бок lmplots?
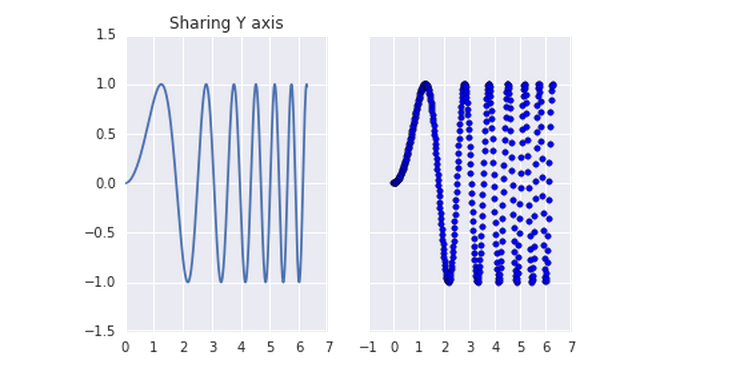
построение 2 distplots или scatterplots в подзаголовке отлично работает:
import matplotlib.pyplot as plt
import numpy as np
import seaborn as sns
import pandas as pd
%matplotlib inline

# create df
x = np.linspace(0, 2 * np.pi, 400)
df = pd.DataFrame({'x': x, 'y': np.sin(x ** 2)})

# Two subplots
f, (ax1, ax2) = plt.subplots(1, 2, sharey=True)
ax1.plot(df.x, df.y)
ax1.set_title('Sharing Y axis')
ax2.scatter(df.x, df.y)

plt.show()
но когда я делаю то же самое с lmplot вместо любого из других типов диаграмм я получаю ошибку:
AttributeError: объект "AxesSubplot" не имеет атрибута "lmplot"
есть ли способ построить эти типы диаграмм бок о бок?
1 ответов
вы получаете эту ошибку, потому что matplotlib и его объекты полностью не знают о функциях seaborn.
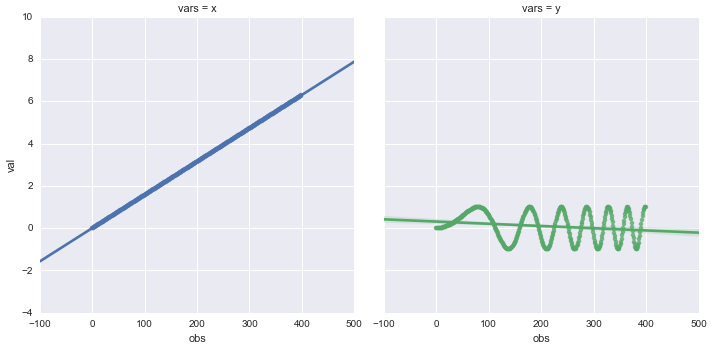
передайте свои объекты axes (т. е. ax1 и ax2) к seaborn.regplot или вы можете пропустить эти определения и использовать col kwarg из seaborn.lmplot
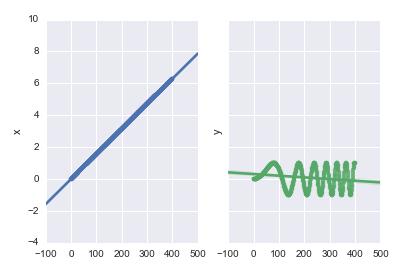
С тем же импортом, предварительно определив свои оси и используя regplot выглядит так:
# create df
x = np.linspace(0, 2 * np.pi, 400)
df = pd.DataFrame({'x': x, 'y': np.sin(x ** 2)})
df.index.names = ['obs']
df.columns.names = ['vars']

idx = np.array(df.index.tolist(), dtype='float')  # make an array of x-values

# call regplot on each axes
fig, (ax1, ax2) = plt.subplots(ncols=2, sharey=True)
sns.regplot(x=idx, y=df['x'], ax=ax1)
sns.regplot(x=idx, y=df['y'], ax=ax2)
использование lmplot требует вашего dataframe, чтобы быть аккуратным. Продолжая из кода выше:
tidy = (
    df.stack() # pull the columns into row variables
      .to_frame() # convert the resulting Series to a DataFrame
      .reset_index() # pull the resulting MultiIndex into the columns
      .rename(columns={0: 'val'}) # rename the unnamed column
)
sns.lmplot(x='obs', y='val', col='vars', hue='vars', data=tidy)


