Как сделать сюжет sunburst в R или Python?
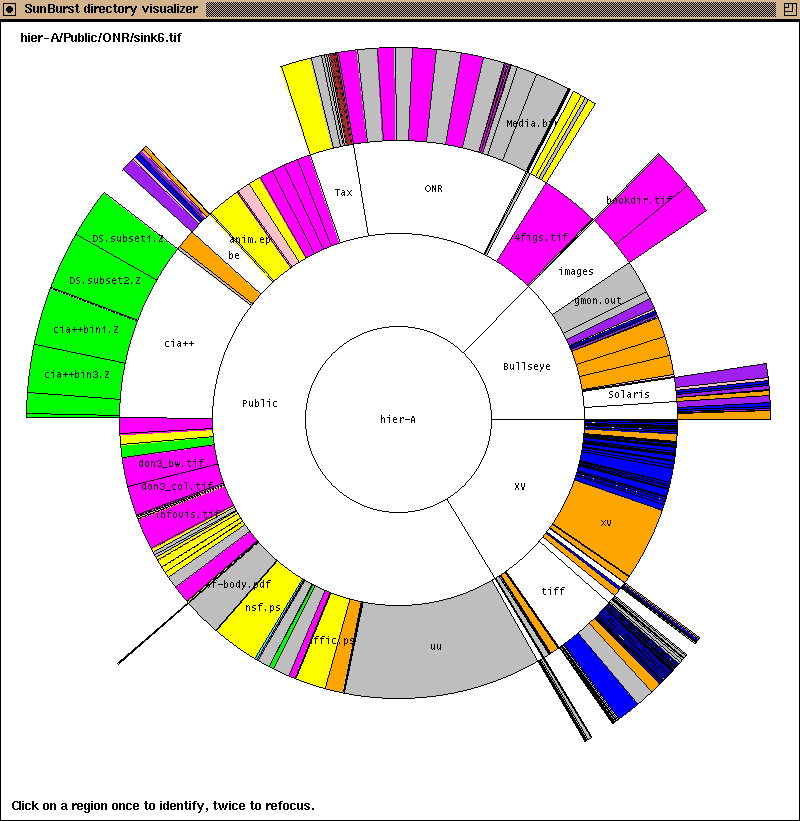
до сих пор мне не удалось найти библиотеку R, которая может создать сюжет sunburst, подобный Джон Стаско. Кто-нибудь знает, как это сделать в R или Python?
7 ответов
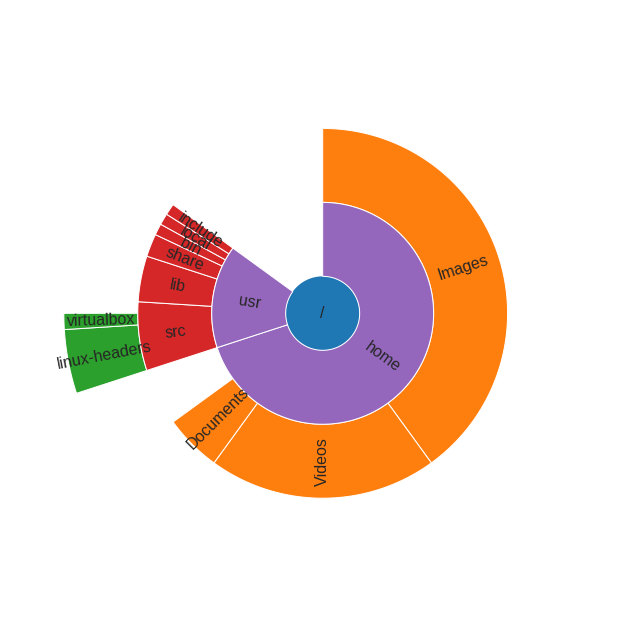
Python версия диаграммы sunburst с использованием баров matplotlib в полярной проекции:
import numpy as np
import matplotlib.pyplot as plt

def sunburst(nodes, total=np.pi * 2, offset=0, level=0, ax=None):
    ax = ax or plt.subplot(111, projection='polar')

    if level == 0 and len(nodes) == 1:
        label, value, subnodes = nodes[0]
        ax.bar([0], [0.5], [np.pi * 2])
        ax.text(0, 0, label, ha='center', va='center')
        sunburst(subnodes, total=value, level=level + 1, ax=ax)
    elif nodes:
        d = np.pi * 2 / total
        labels = []
        widths = []
        local_offset = offset
        for label, value, subnodes in nodes:
            labels.append(label)
            widths.append(value * d)
            sunburst(subnodes, total=total, offset=local_offset,
                     level=level + 1, ax=ax)
            local_offset += value
        values = np.cumsum([offset * d] + widths[:-1])
        heights = [1] * len(nodes)
        bottoms = np.zeros(len(nodes)) + level - 0.5
        rects = ax.bar(values, heights, widths, bottoms, linewidth=1,
                       edgecolor='white', align='edge')
        for rect, label in zip(rects, labels):
            x = rect.get_x() + rect.get_width() / 2
            y = rect.get_y() + rect.get_height() / 2
            rotation = (90 + (360 - np.degrees(x) % 180)) % 360
            ax.text(x, y, label, rotation=rotation, ha='center', va='center')

    if level == 0:
        ax.set_theta_direction(-1)
        ax.set_theta_zero_location('N')
        ax.set_axis_off()
пример использования этой функции:
data = [
    ('/', 100, [
        ('home', 70, [
            ('Images', 40, []),
            ('Videos', 20, []),
            ('Documents', 5, []),
        ]),
        ('usr', 15, [
            ('src', 6, [
                ('linux-headers', 4, []),
                ('virtualbox', 1, []),

            ]),
            ('lib', 4, []),
            ('share', 2, []),
            ('bin', 1, []),
            ('local', 1, []),
            ('include', 1, []),
        ]),
    ]),
]

sunburst(data)
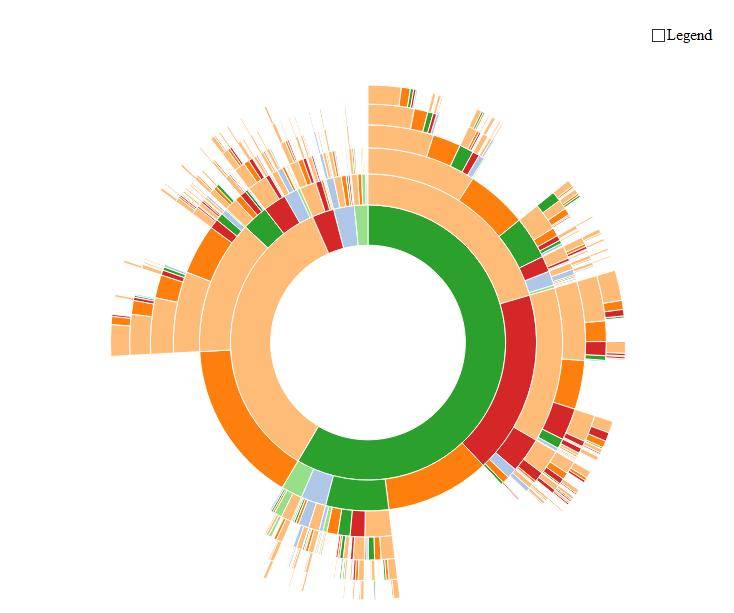
вы даже можете легко создать интерактивную версию с помощью R:
# devtools::install_github("timelyportfolio/sunburstR")

library(sunburstR)
# read in sample visit-sequences.csv data provided in source
# https://gist.github.com/kerryrodden/7090426#file-visit-sequences-csv
sequences <- read.csv(
  system.file("examples/visit-sequences.csv",package="sunburstR")
  ,header=F
  ,stringsAsFactors = FALSE
)

sunburst(sequences)
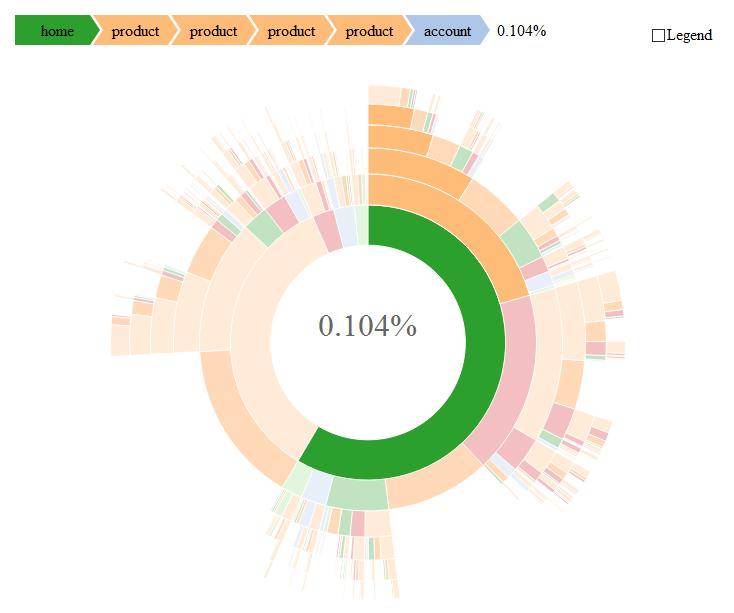
...и когда вы перемещаете мышь над ним, происходит волшебство:
редактировать
Официальный сайт этого пакета можно найти здесь (со многими примерами!): https://github.com/timelyportfolio/sunburstR
Hat Tip to @timelyportfolio, который создал это впечатляющий кусок кода!
вы можете создать что-то по линиям сюжета sunburst, используя geom_tile С ggplot2 пакета. Давайте сначала создадим некоторые случайные данные:
require(ggplot2); theme_set(theme_bw())
require(plyr)
dat = data.frame(expand.grid(x = 1:10, y = 1:10),
                 z = sample(LETTERS[1:3], size = 100, replace = TRUE))
а затем создайте растровый график. Здесь x ось на графике связана с x переменная dat на y ось y переменная, и заливка пикселей в z переменной. Это дает следующий сюжет:
p = ggplot(dat, aes(x = x, y = y, fill = z)) + geom_tile()
print(p)
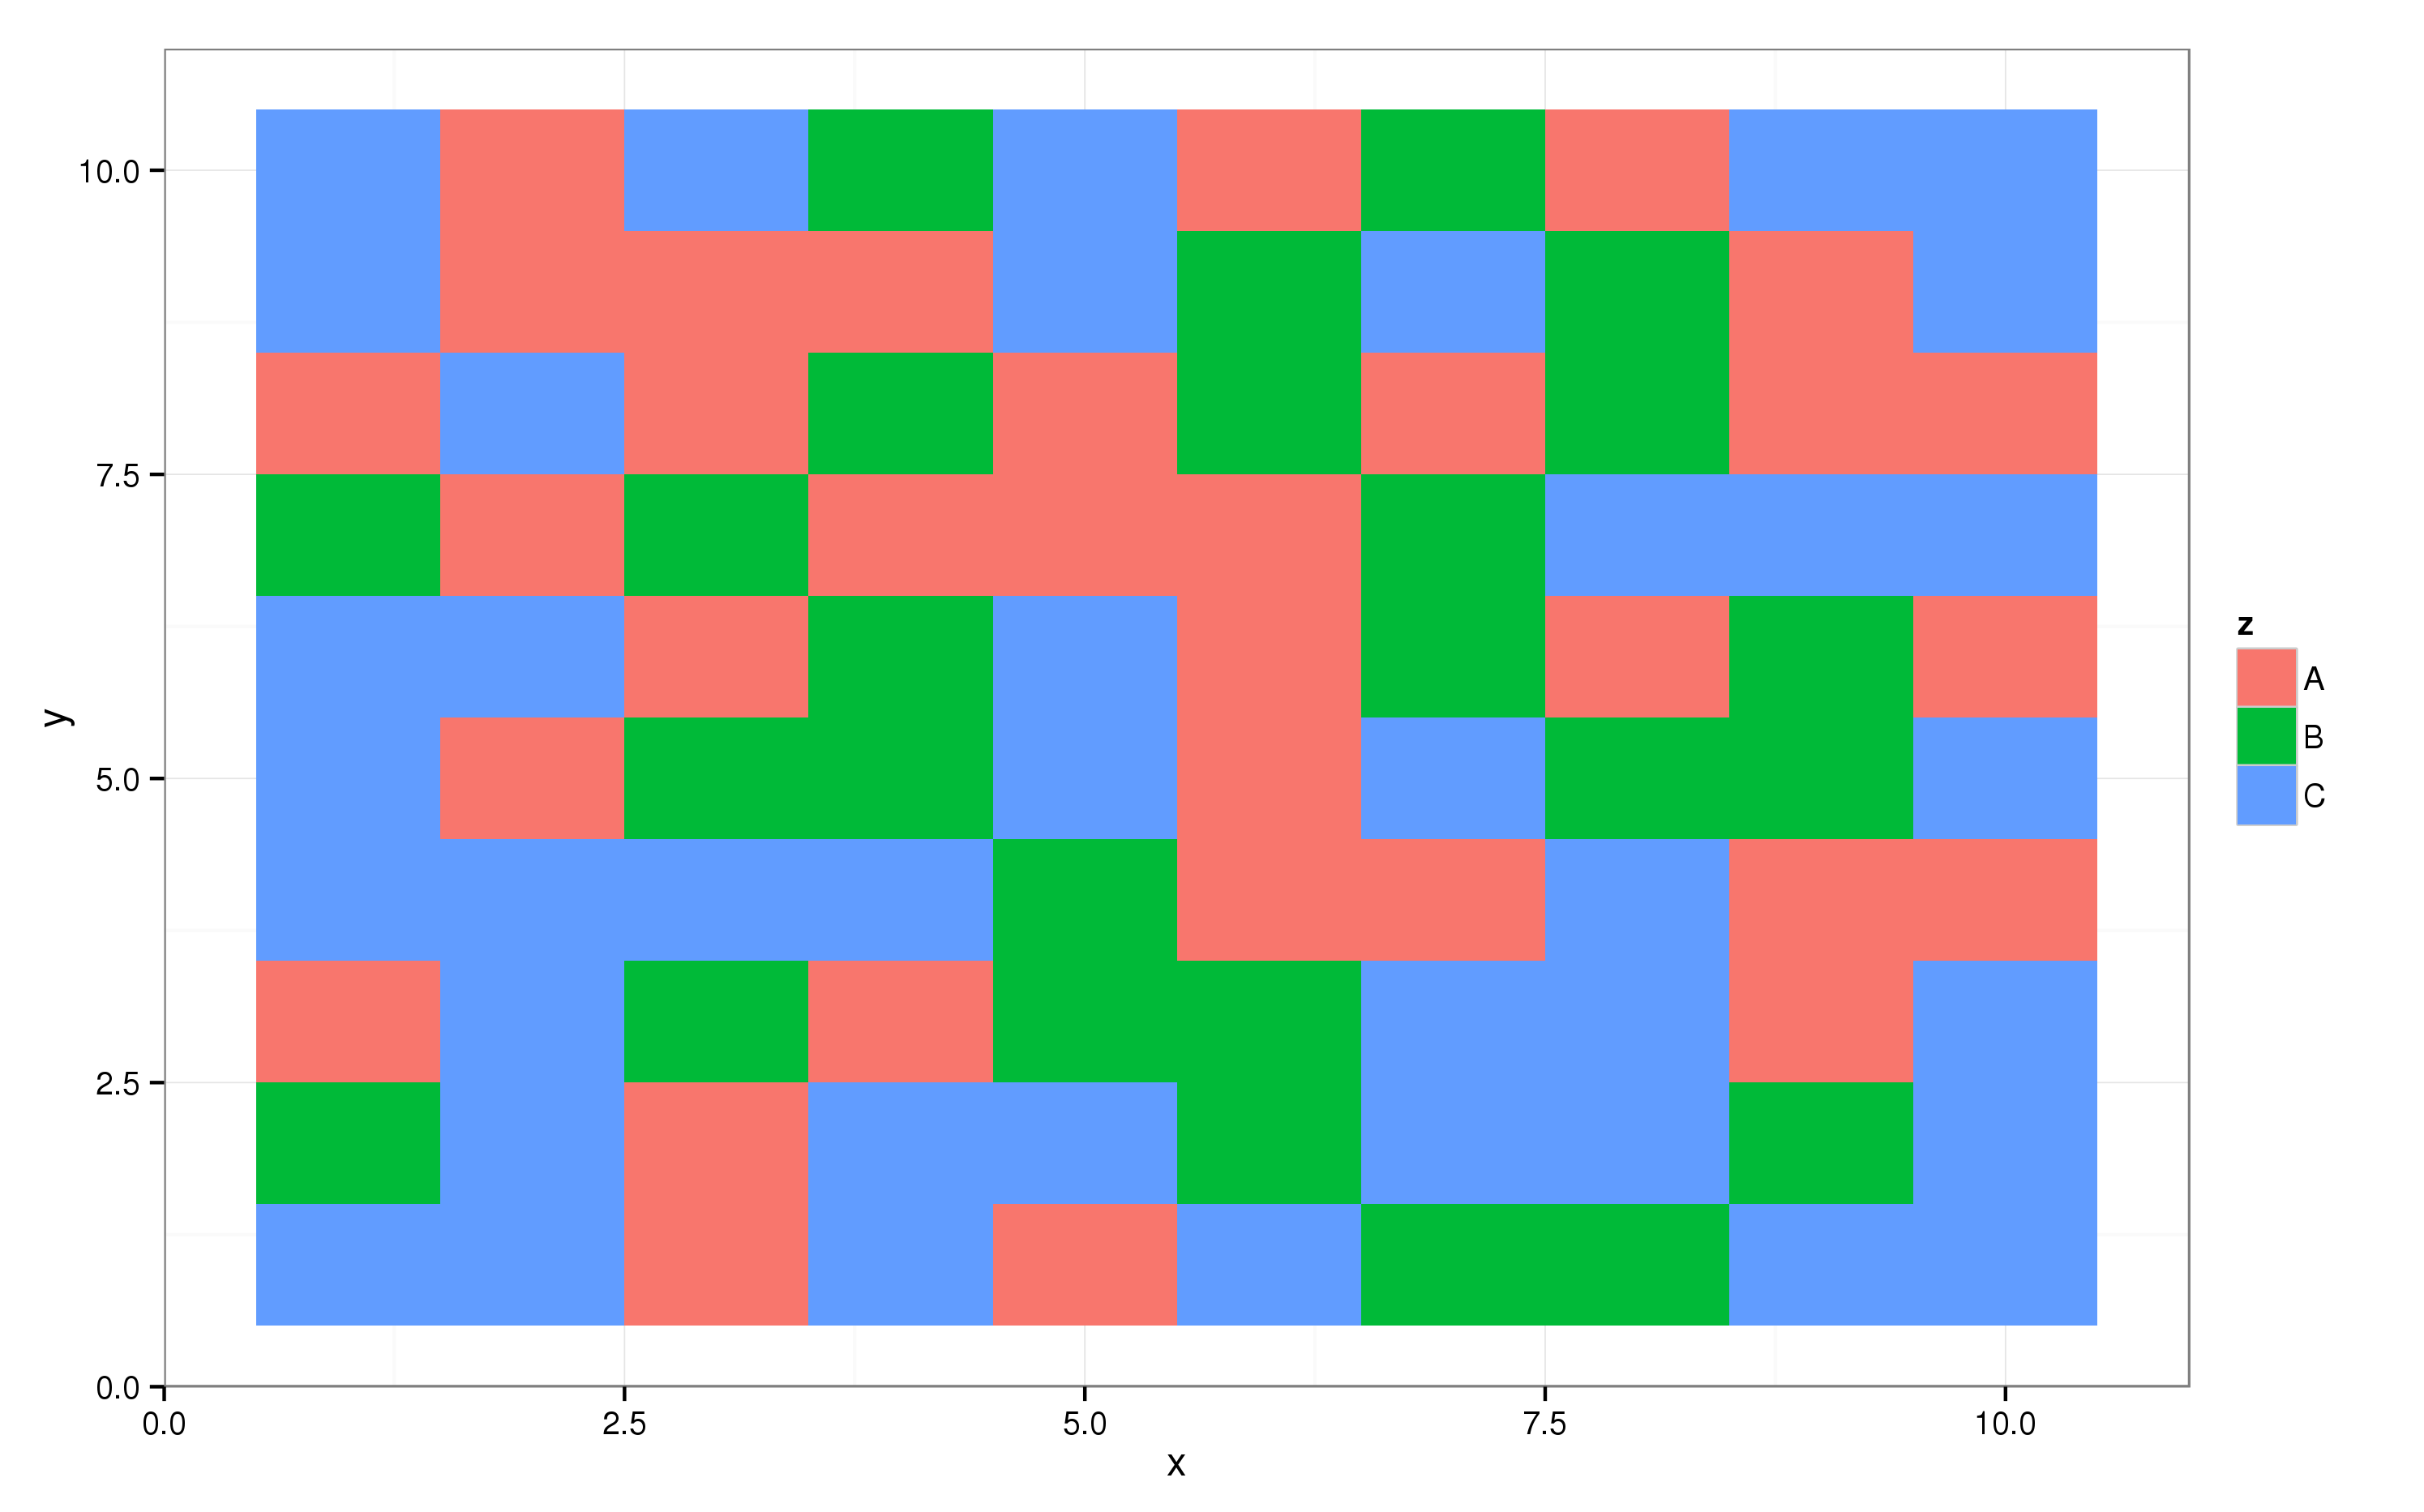
на ggplot2 пакет поддерживает все виды преобразований координат, одно из которых принимает одну ось и проецирует ее на окружность, т. е. полярные координаты:
p + coord_polar()
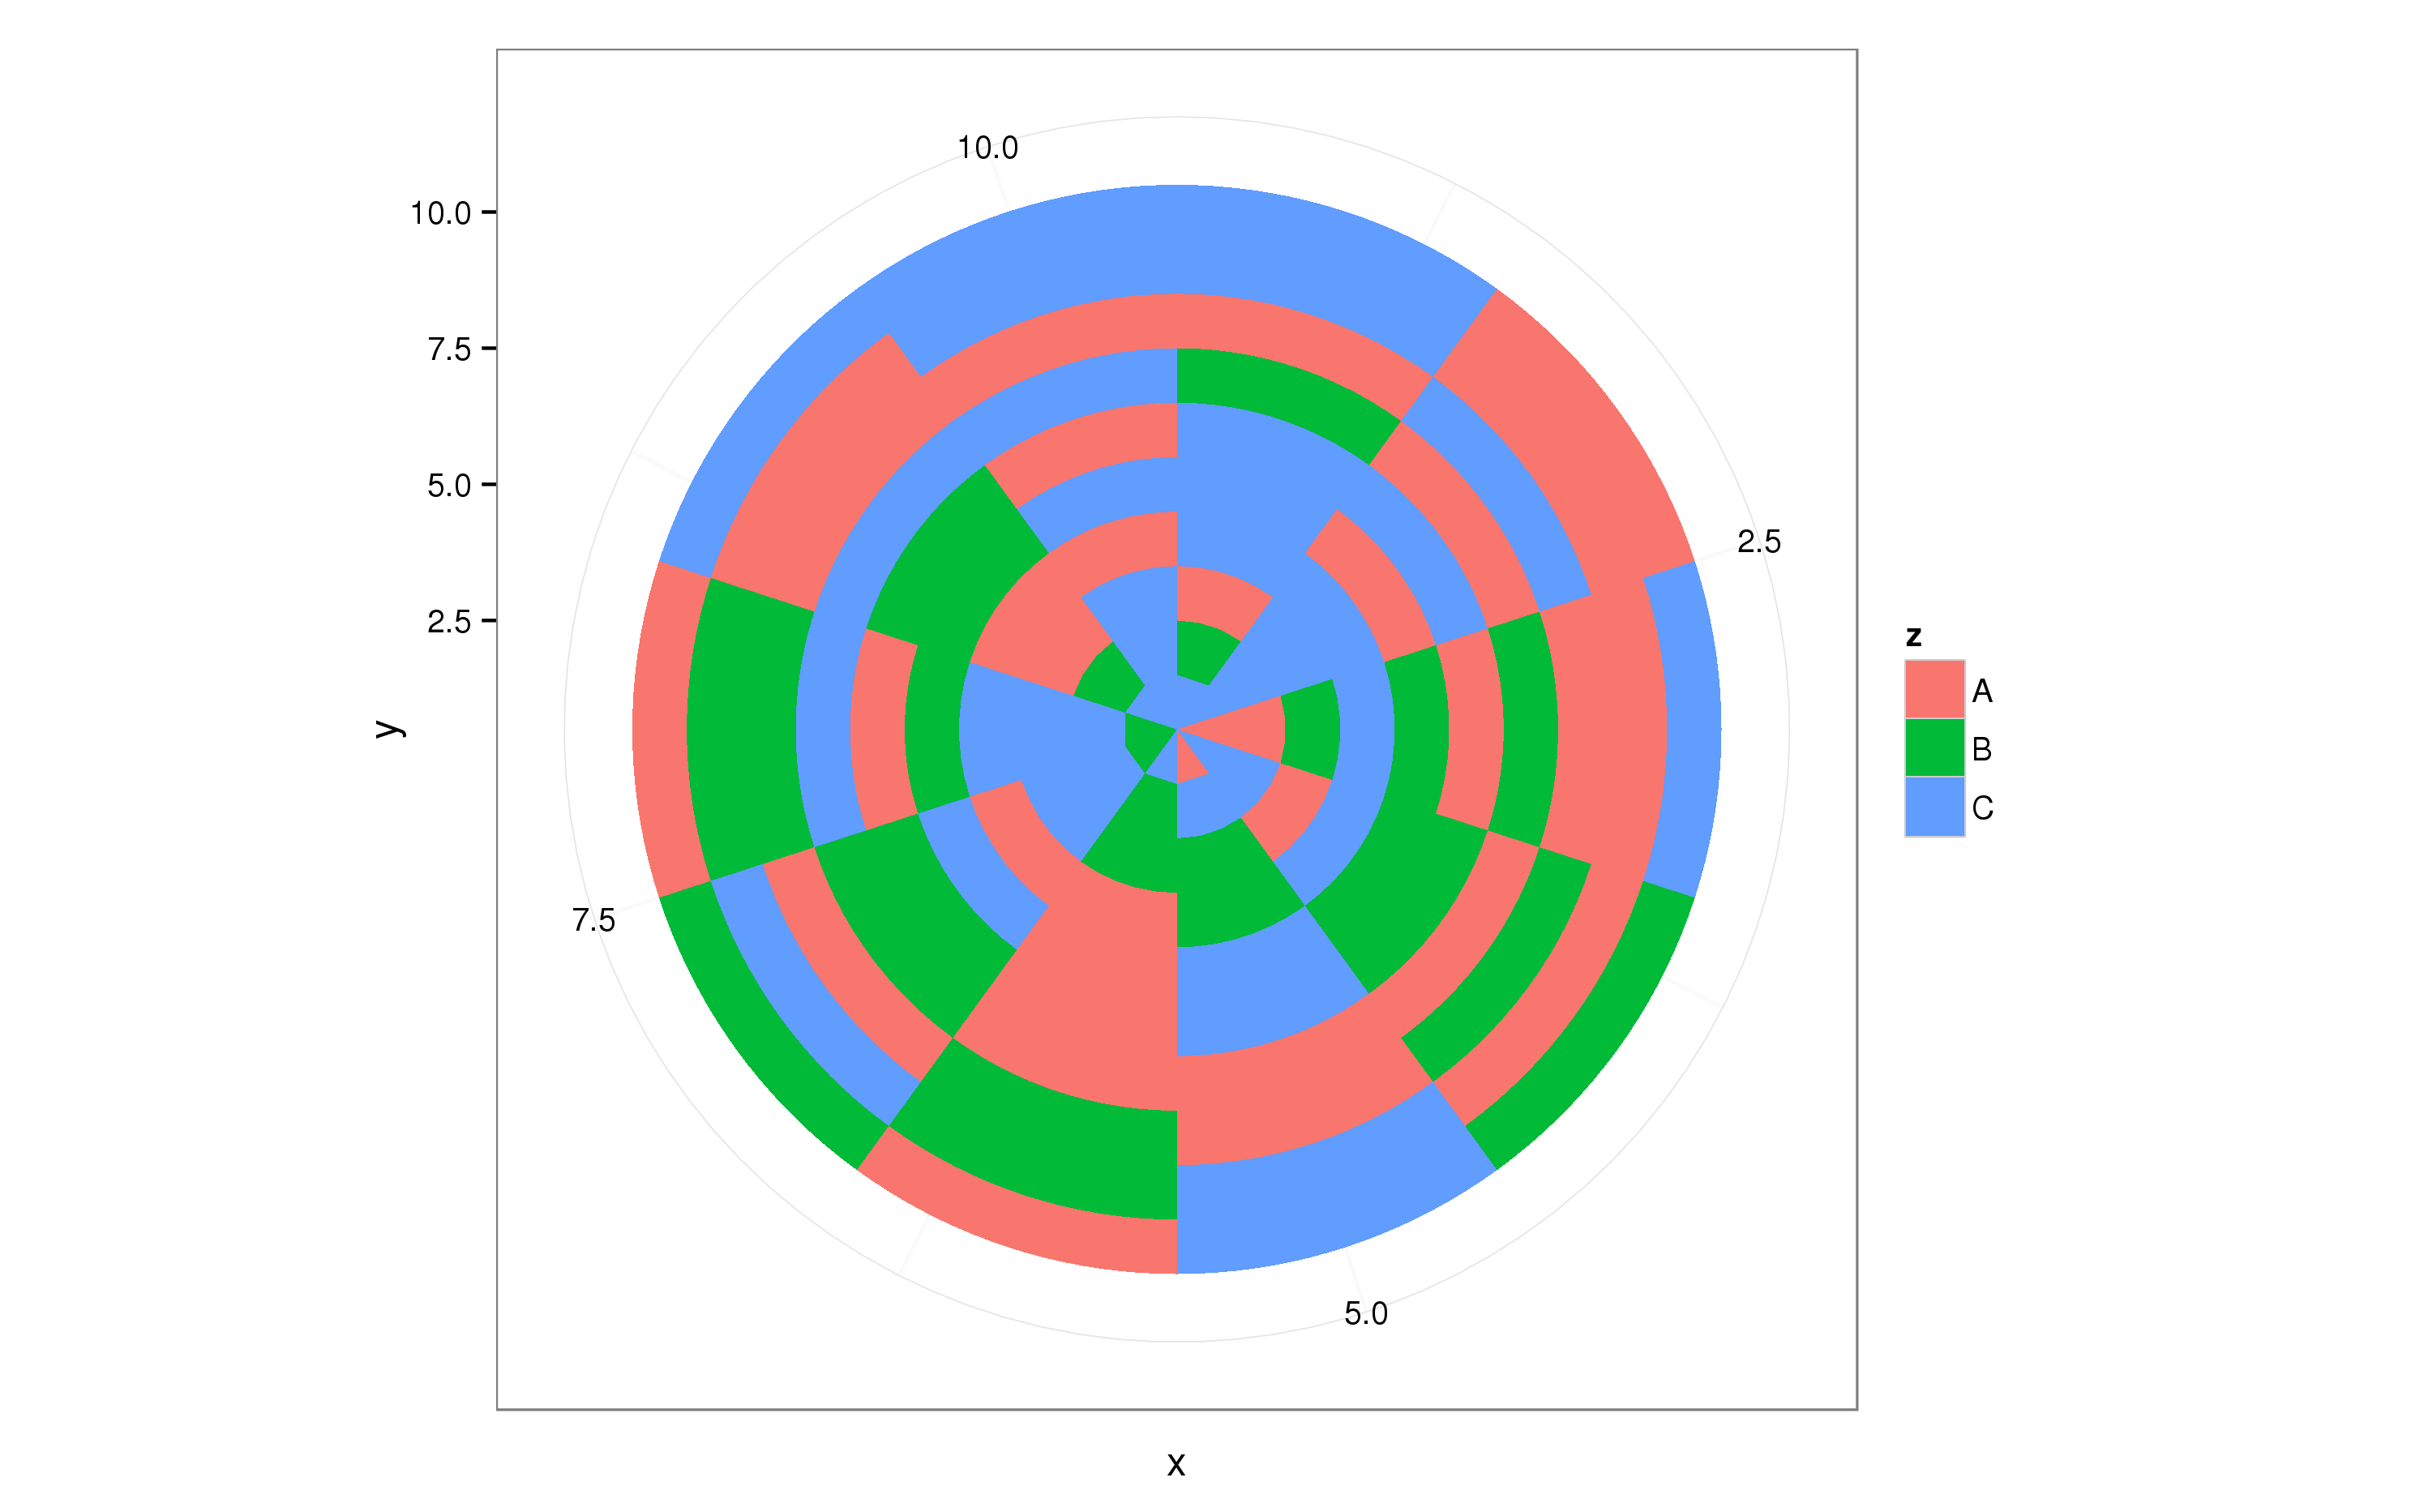
это примерно делает то, что вам нужно, теперь вы можете настроить dat чтобы получить желаемый результат.
есть пакет под названием ggsunburst. К сожалению, не в CRAN, но вы можете установить следующую инструкцию на веб-сайте:http://genome.crg.es / ~didac/ggsunburst/ggsunburst.html.
надеюсь, что это поможет людям, которые все еще ищут хороший пакет, как это.
С уважением,
Я знаю только пару библиотек, которые делают это изначально:
- на Javascript Infovis Toolkit (jit) (пример).
- D3.js
- данные, используемые в Простой Инструмент Сюжета (SPT).
ни один из них не находится в Python или R, но получение скрипта python/R для записи простого файла JSON, который может быть загружен любой из библиотек javascript, должно быть довольно достижимый.
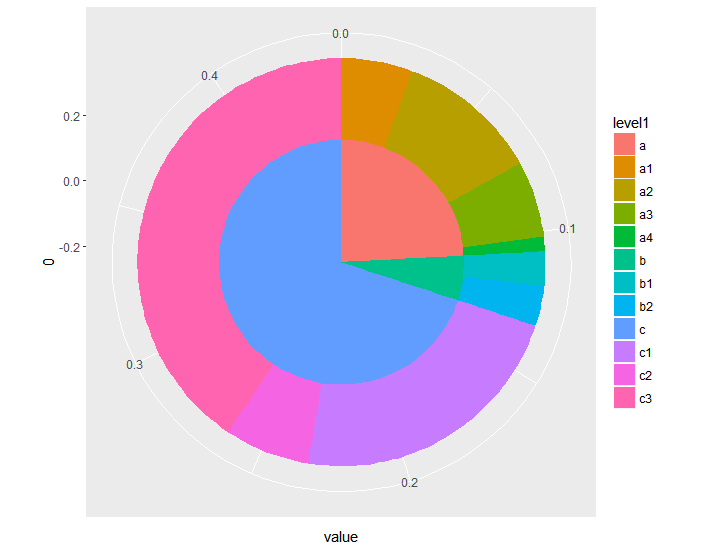
здесь ggplot2 sunburst с двумя слоями.
основная идея состоит в том, чтобы просто сделать другой бар для каждого слоя и сделать бары шире для внешних слоев. Я также испортил ось x, чтобы убедиться, что в середине внутренней круговой диаграммы нет отверстия. Таким образом, вы можете управлять внешним видом sunburst, изменяя значения ширины и оси X.
library(ggplot2)

# make some fake data
df <- data.frame(
    'level1'=c('a', 'a', 'a', 'a', 'b', 'b', 'c', 'c', 'c'),
    'level2'=c('a1', 'a2', 'a3', 'a4', 'b1', 'b2', 'c1', 'c2', 'c3'),
    'value'=c(.025, .05, .027, .005, .012, .014, .1, .03, .18))

# sunburst plot
ggplot(df, aes(y=value)) +
    geom_bar(aes(fill=level1, x=0), width=.5, stat='identity') +
    geom_bar(aes(fill=level2, x=.25), width=.25, stat='identity') +
    coord_polar(theta='y')
единственный недостаток это сравнивало к sunburst-специфическому программное обеспечение предполагает, что вы хотите, чтобы внешние слои были исчерпывающими (т. е. без пробелов). "Частично исчерпывающие" внешние слои (как и в некоторых других примерах), безусловно, возможны, но более сложные.
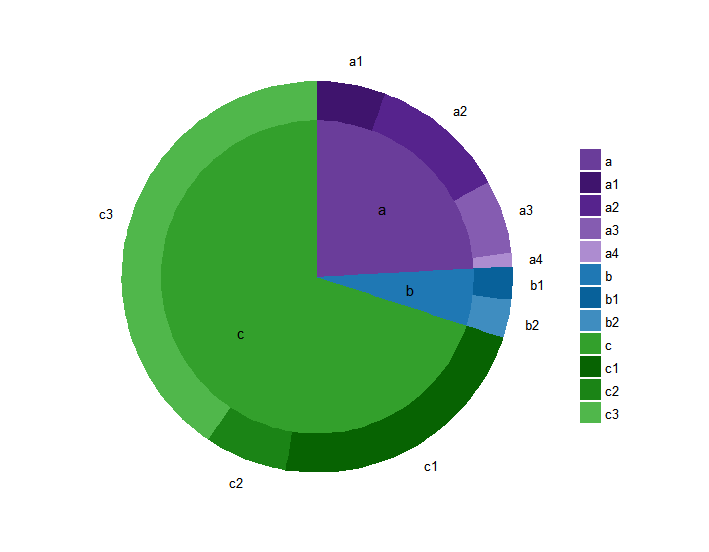
для полноты, здесь он очищается с более приятным форматированием и метками:
library(data.table)

# compute cumulative sum for outer labels
df <- data.table(df)
df[, cumulative:=cumsum(value)-(value/2)]

# store labels for inner circle
inner_df <- df[, c('level1', 'value'), with=FALSE]
inner_df[, level1_value:=sum(value), by='level1']
inner_df <- unique(text_df[, c('level1', 'level1_value'), with=FALSE])
inner_df[, cumulative:=cumsum(level1_value)]
inner_df[, prev:=shift(cumulative)]
inner_df[is.na(prev), position:=(level1_value/2)]
inner_df[!is.na(prev), position:=(level1_value/2)+prev]

colors <- c('#6a3d9a', '#1F78B4', '#33A02C', '#3F146D', '#56238D', '#855CB1', '#AD8CD0', '#08619A', '#3F8DC0', '#076302', '#1B8416', '#50B74B')
colorNames <- c(unique(as.character(df$level1)), unique(as.character(df$level2)))
names(colors) <- colorNames

ggplot(df, aes(y=value, x='')) +
    geom_bar(aes(fill=level2, x=.25), width=.25, stat='identity') +
    geom_bar(aes(fill=level1, x=0), width=.5, stat='identity') +
    geom_text(data=inner_df, aes(label=level1, x=.05, y=position)) +
    coord_polar(theta='y') +
    scale_fill_manual('', values=colors) +
    theme_minimal() +
    guides(fill=guide_legend(ncol=1)) +
    labs(title='') +
    scale_x_continuous(breaks=NULL) +
    scale_y_continuous(breaks=df$cumulative, labels=df$level2, 5) +
    theme(axis.title.x=element_blank(), axis.title.y=element_blank(), panel.border=element_blank(), panel.grid=element_blank())
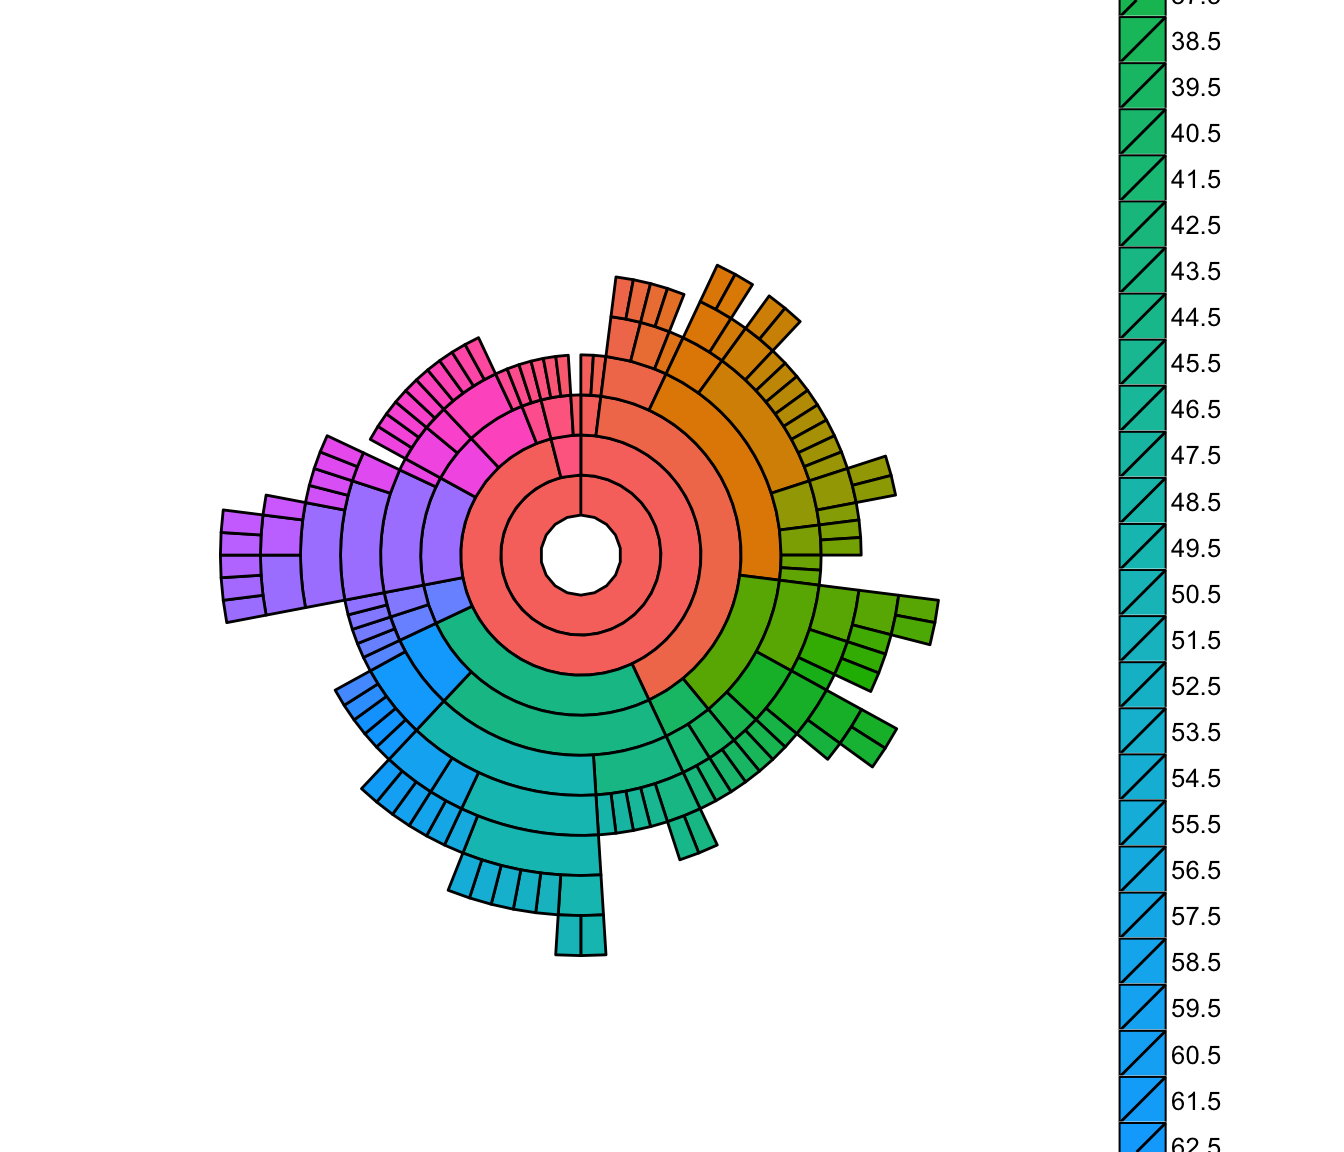
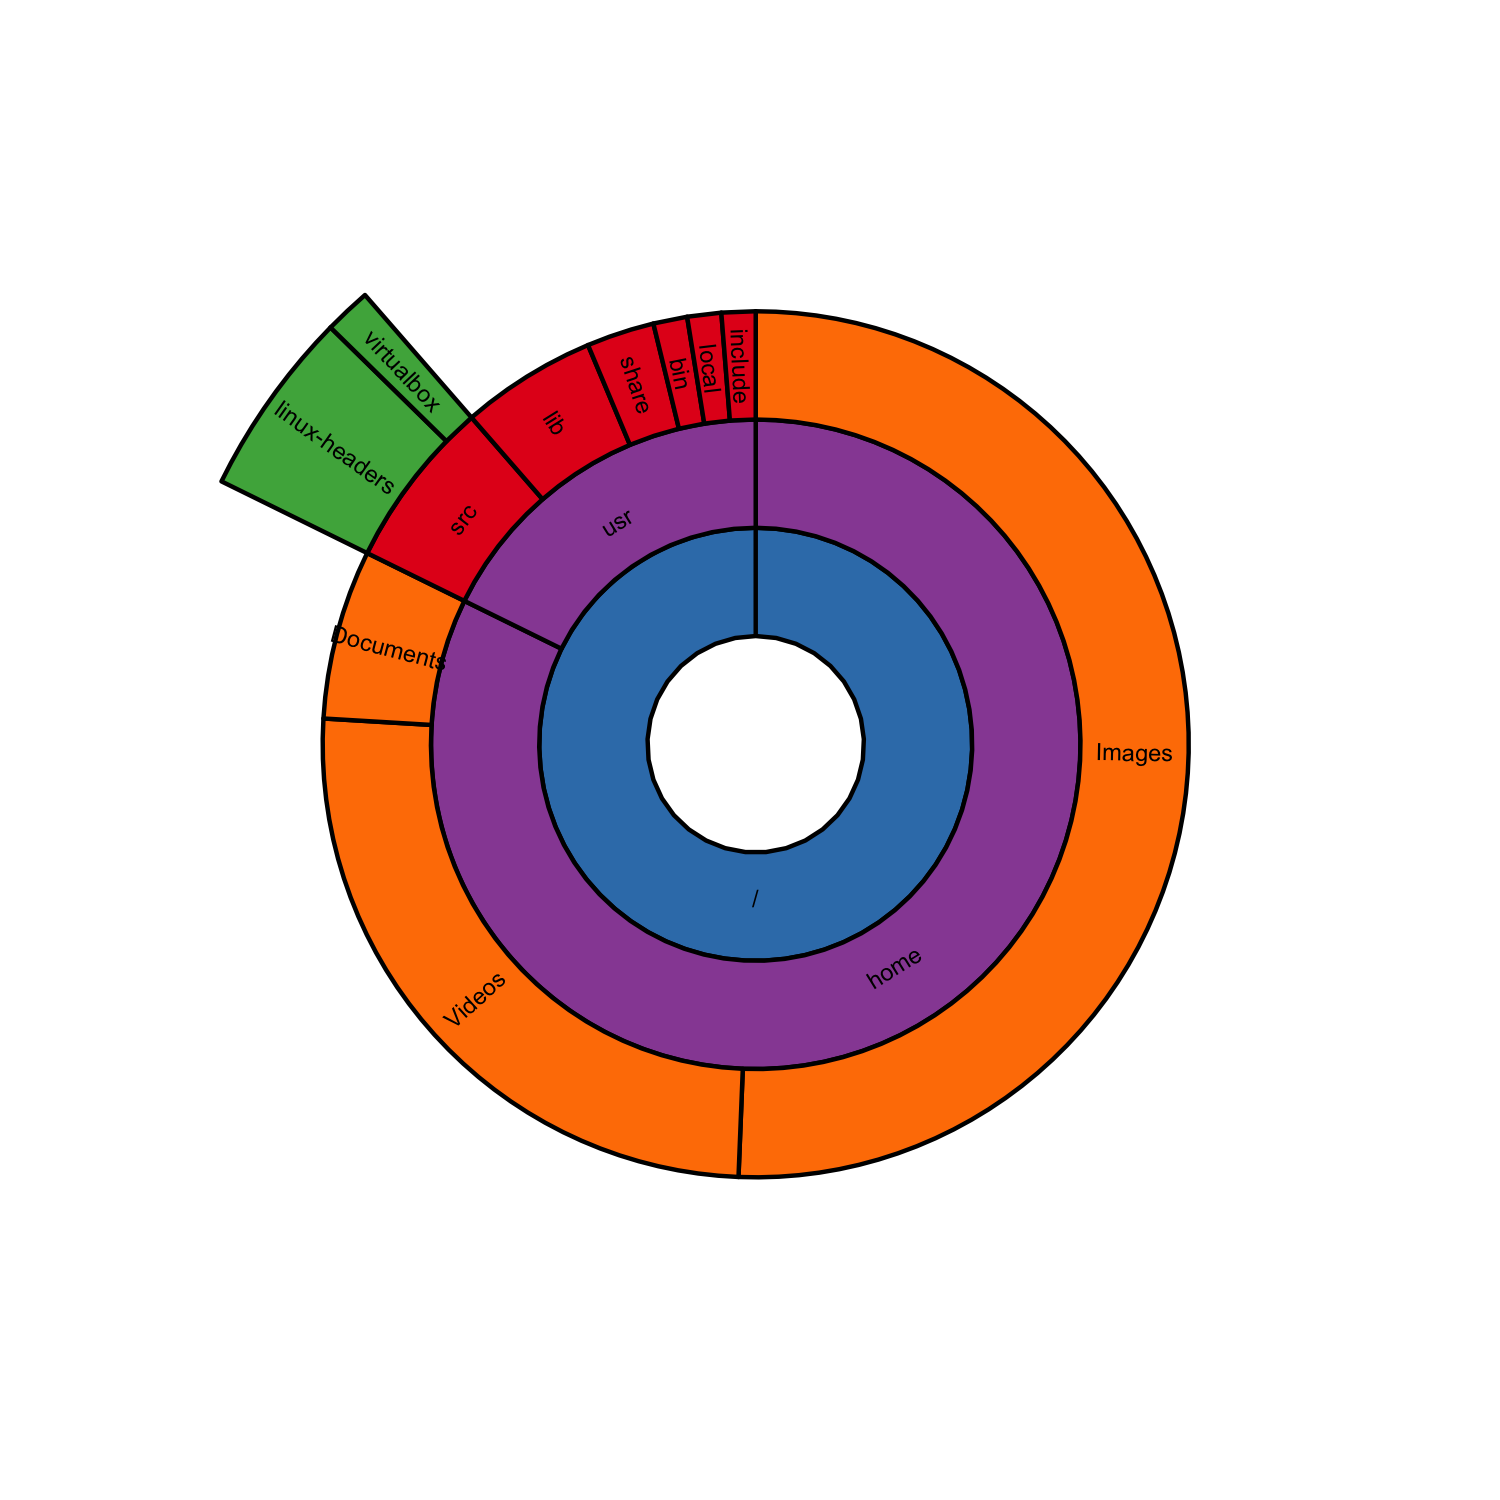
поскольку jbkunst упомянул ggsunburst, здесь я публикую пример для воспроизведения sunburst sirex.
это не совсем то же самое, потому что в ggsunburst угол узла равен сумме углов его дочерних узлов.
# install ggsunburst package
if (!require("ggplot2")) install.packages("ggplot2")
if (!require("rPython")) install.packages("rPython")
install.packages("http://genome.crg.es/~didac/ggsunburst/ggsunburst_0.0.9.tar.gz", repos=NULL, type="source")
library(ggsunburst)

# dataframe
# each row corresponds to a node in the hierarchy
# parent and node are required, the rest are optional attributes
# the attributes correspond to the node, not its parent
df <- read.table(header = T, sep = ",", text = "
parent,node,size,color,dist
,/,,B,1
/,home,,D,1
home,Images, 40,E,1
home,Videos, 20,E,1
home,Documents, 5,E,1
/,usr,,D,1
usr,src,,A,1
src,linux-headers, 4,C,1.5
src,virtualbox, 1,C,1.5
usr,lib, 4,A,1
usr,share, 2,A,1
usr,bin, 1,A,1
usr,local, 1,A,1
usr,include, 1,A,1
")

write.table(df, 'df.csv', sep = ",", row.names = F)

# compute coordinates from dataframe
# "node_attributes" is used to pass the attributes other than "size" and "dist",
# which are special attributes that alter the dimensions of the nodes
sb <- sunburst_data('df.csv', sep = ",", type = "node_parent", node_attributes = "color")

# plot
sunburst(sb, node_labels = T, node_labels.min = 10, rects.fill.aes = "color") +
  scale_fill_brewer(palette = "Set1", guide = F)

