правильно форматирования в две строки надпись в ggplot2
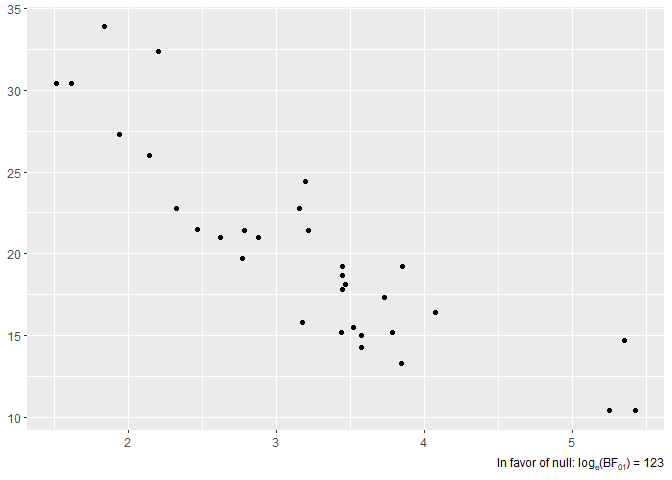
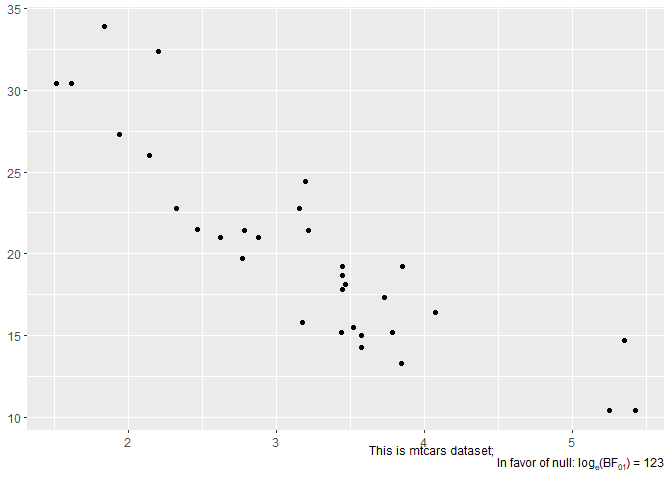
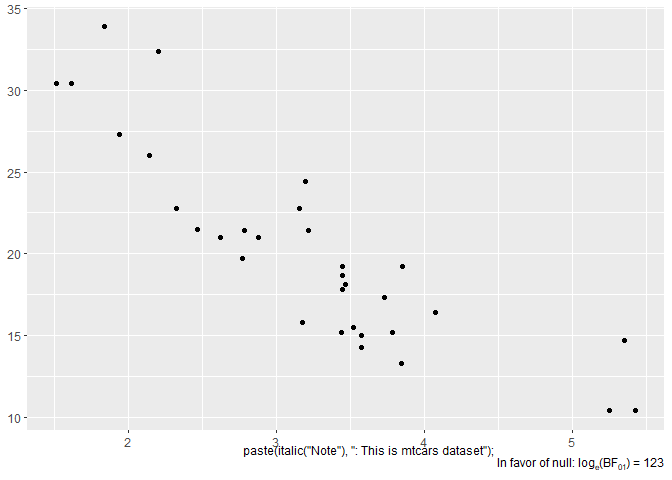
Я работаю над пользовательской функцией, которая может добавлять двухстрочные подписи к сюжетам, и я хочу, чтобы заголовок был отформатирован правильно независимо от того, что пользователь может выбрать для ввода ("character" или "expression"). Я создал пример игрушки, который иллюстрирует две проблемы с тем, как функция была реализована в настоящее время-
- когда подпись не
NULLдве линии не выровнены по право. - при вводе выражения, связанные заголовок полностью искореженный.
EDIT:
в случае, если у вас есть другое решение, которое достигает того же (если пользователь предоставил caption is NULL, тогда однострочное выражение по умолчанию печатается как заголовок, в противном случае двухстрочное выражение печатается как заголовок), я также открыт для этого.
это важно хотя, что класс объекта остается "ggplot" потому что я хотел бы сделать дальнейшие модификации полученного участка с использованием ggplot2 функции.
# needed libraries
library(ggplot2)

# custom function to prepare a caption
caption_maker <- function(caption) {

  # if caption is not null then add line separator
  if (!is.null(caption)) {
    caption <- paste(caption, "; n", sep = "")
  }

  # prepare the caption with additional info
  caption <- base::substitute(
    expr =
      paste(
        y,
        "In favor of null: ",
        "log"["e"],
        "(BF"["01"],
        ") = ",
        bf
      ),
    env = base::list(
      y = caption,
      bf = 123
    )
  )

  # return the message
  return(caption)
}

# custom function to add labels to the plot
plot_maker <-
  function(xlab = NULL,
             ylab = NULL,
             title = NULL,
             caption = NULL) {
    caption.text <- caption_maker(caption = caption)

    plot <- ggplot(mtcars, aes(wt, mpg)) + geom_point() +
      ggplot2::labs(
        x = xlab,
        y = ylab,
        title = title,
        caption = caption.text
      )

    # return the plot
    return(plot)
  }

# this works just fine
plot_maker(caption = NULL)

# this works but the caption is not aligned properly
plot_maker(caption = "This is mtcars dataset")

# this works but the caption is all mangled
plot_maker(
  caption =
    expression(paste(italic("Note"), ": This is mtcars dataset"))
)

создано 2018-08-22 reprex пакет (версии v0.2.0.9000).
2 ответов
Как насчет этого:
# needed libraries
library(ggplot2)

# custom function to prepare a caption
caption_maker <- function(caption) {

  # prepare the caption with additional info
  caption <- base::substitute(
    atop(y,
         paste(
           "In favor of null: ",
           "log"["e"],
           "(BF"["01"],
           ") = ",
           bf
         )),
    env = base::list(
      bf = 123,
      y = caption
    )
  )

  # return the message
  return(caption)
}

# custom function to add labels to the plot
plot_maker <-
  function(xlab = NULL,
           ylab = NULL,
           title = NULL,
           caption = NULL) {
    caption.text <- caption_maker(caption = caption)

    plot <- ggplot(mtcars, aes(wt, mpg)) + geom_point() +
      ggplot2::labs(
        x = xlab,
        y = ylab,
        title = title,
        caption = caption.text)

    # return the plot
    return(plot)
  }


plot_maker(caption = NULL)
plot_maker(caption = "This is mtcars:")
plot_maker(xlab = "x Axis Title",
  caption = substitute(paste(italic("Note"), ": This is mtcars dataset"))
)
Я получил atop идея от этого вопрос
адаптация ответа на связанный вопрос,
library(gridExtra)
library(grid)
library(ggplot2)

element_custom <- function() {
  structure(list(), class = c("element_custom", "element_text"))
}

element_grob.element_custom <- function(element, label="", ...)  {

  mytheme <- ttheme_minimal(core = list(fg_params = list(parse=TRUE,
                                                         hjust=0, x=0)))
  disect <- strsplit(label, "\n")[[1]]
  tg <- tableGrob(as.matrix(disect), theme=mytheme)
  tg$vp = viewport(just=1,x=1, width = sum(tg$widths))
  tg
}

heightDetails.gtable <- function(x) sum(x$heights)

ggplot(iris, aes(Sepal.Length, Sepal.Width)) +
  geom_line() +
  labs(x= "italic('Note')*': this is mtcars'\n 'in favour of null: '*log[10](bf['01'])=='123'")+
  (theme_grey() %+replace% theme(axis.title.x = element_custom()))
